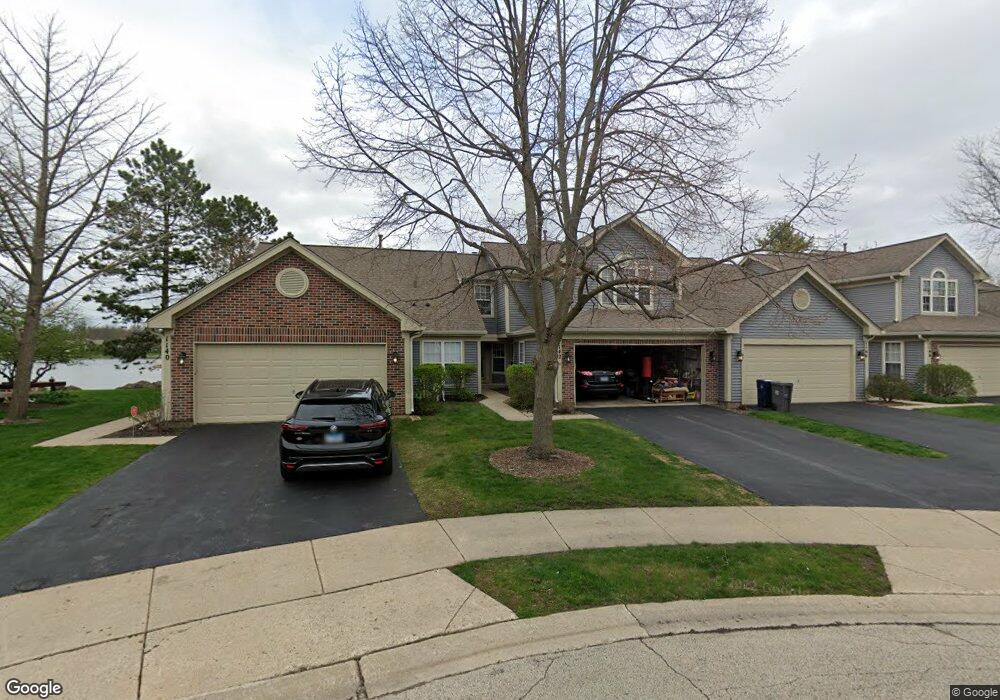
1142 Coldspring Rd Unit 3 Elgin, IL 60120
Cobblers Crossing NeighborhoodEstimated Value: $316,000 - $324,000
3
Beds
3
Baths
1,565
Sq Ft
$204/Sq Ft
Est. Value
About This Home
This home is located at 1142 Coldspring Rd Unit 3, Elgin, IL 60120 and is currently estimated at $319,013, approximately $203 per square foot. 1142 Coldspring Rd Unit 3 is a home located in Cook County with nearby schools including Lincoln Elementary School, Larsen Middle School, and Elgin High School.
Ownership History
Date
Name
Owned For
Owner Type
Purchase Details
Closed on
Jul 7, 2004
Sold by
Cerniglia Craig
Bought by
Graham Jefferson W and Graham Betsy R
Current Estimated Value
Home Financials for this Owner
Home Financials are based on the most recent Mortgage that was taken out on this home.
Original Mortgage
$140,000
Outstanding Balance
$70,764
Interest Rate
6.4%
Mortgage Type
Unknown
Estimated Equity
$248,249
Purchase Details
Closed on
May 1, 2000
Sold by
Hill Kevin R and Hill Amy M
Bought by
Cerniglia Craig
Home Financials for this Owner
Home Financials are based on the most recent Mortgage that was taken out on this home.
Original Mortgage
$125,000
Interest Rate
8.25%
Purchase Details
Closed on
Mar 23, 1998
Sold by
Luciana Patricia A and Baldwin Patricia A
Bought by
Hill Kevin R and Twyman Amy M
Home Financials for this Owner
Home Financials are based on the most recent Mortgage that was taken out on this home.
Original Mortgage
$127,800
Interest Rate
6.75%
Create a Home Valuation Report for This Property
The Home Valuation Report is an in-depth analysis detailing your home's value as well as a comparison with similar homes in the area
Home Values in the Area
Average Home Value in this Area
Purchase History
| Date | Buyer | Sale Price | Title Company |
|---|---|---|---|
| Graham Jefferson W | $200,000 | Metropolitan Title Co | |
| Cerniglia Craig | $157,000 | Chicago Title Insurance Co | |
| Hill Kevin R | $142,000 | -- |
Source: Public Records
Mortgage History
| Date | Status | Borrower | Loan Amount |
|---|---|---|---|
| Open | Graham Jefferson W | $140,000 | |
| Previous Owner | Cerniglia Craig | $125,000 | |
| Previous Owner | Hill Kevin R | $127,800 |
Source: Public Records
Tax History Compared to Growth
Tax History
| Year | Tax Paid | Tax Assessment Tax Assessment Total Assessment is a certain percentage of the fair market value that is determined by local assessors to be the total taxable value of land and additions on the property. | Land | Improvement |
|---|---|---|---|---|
| 2024 | $5,522 | $22,500 | $3,500 | $19,000 |
| 2023 | $5,337 | $22,500 | $3,500 | $19,000 |
| 2022 | $5,337 | $22,500 | $3,500 | $19,000 |
| 2021 | $4,103 | $15,237 | $1,255 | $13,982 |
| 2020 | $4,155 | $15,237 | $1,255 | $13,982 |
| 2019 | $4,138 | $16,930 | $1,255 | $15,675 |
| 2018 | $4,167 | $15,701 | $1,116 | $14,585 |
| 2017 | $4,175 | $15,701 | $1,116 | $14,585 |
| 2016 | $4,208 | $15,701 | $1,116 | $14,585 |
| 2015 | $4,031 | $14,097 | $976 | $13,121 |
| 2014 | $3,923 | $14,097 | $976 | $13,121 |
| 2013 | $3,774 | $14,097 | $976 | $13,121 |
Source: Public Records
Map
Nearby Homes
- 1102 Coldspring Rd
- 879 Dandridge Ct
- 1503 Kenneth Cir
- 1080 Wakefield Dr
- 930 Jefferson Ave
- 904 Chippewa Dr
- 360 Olympia Ct
- 6034 Delaney Dr Unit 171
- 12N100 Berner Dr
- Vacant Lot Parcel 1 Congdon Ave
- 1818 Kelberg Ave
- 1816 Kelberg Ave Unit 484
- 899 Carl Ave
- 1212 Shawford Way Unit 17
- 6099 Canterbury Ln Unit 302
- 6073 Canterbury Ln Unit 335
- 698 Hiawatha Dr
- 1104 Loganbury Ct Unit 33211
- 130 Stonehurst Dr
- 1103 Hiawatha Dr
- 1144 Coldspring Rd
- 1140 Coldspring Rd
- 1146 Coldspring Rd
- 1138 Coldspring Rd
- 1136 Coldspring Rd
- 1134 Coldspring Rd
- 1132 Coldspring Rd
- 1152 Coldspring Rd
- 1130 Coldspring Rd
- 1154 Coldspring Rd Unit 3
- 1128 Coldspring Rd
- 1156 Coldspring Rd Unit 3
- 1162 Coldspring Rd
- 1126 Coldspring Rd
- 1129 Coldspring Rd
- 1141 Coldspring Rd
- 1143 Coldspring Rd
- 1153 Coldspring Rd Unit 353
- 1145 Coldspring Rd
- 1164 Coldspring Rd Unit 15