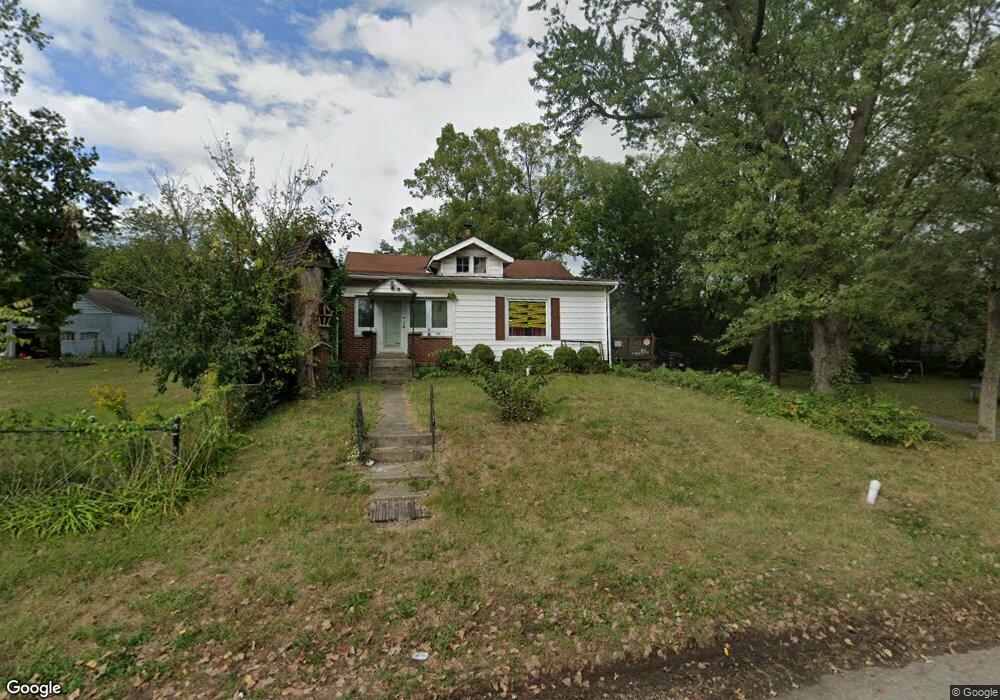
1142 Edgecombe Ave Indianapolis, IN 46227
University Heights NeighborhoodEstimated Value: $160,000 - $206,564
2
Beds
1
Bath
2,114
Sq Ft
$85/Sq Ft
Est. Value
About This Home
This home is located at 1142 Edgecombe Ave, Indianapolis, IN 46227 and is currently estimated at $180,641, approximately $85 per square foot. 1142 Edgecombe Ave is a home located in Marion County with nearby schools including Eleanor Skillen School No. 34, Ralph Waldo Emerson School 58, and George W. Julian School No. 57.
Ownership History
Date
Name
Owned For
Owner Type
Purchase Details
Closed on
Jul 3, 2020
Sold by
Conway Mark A
Bought by
Conway Mark A and Conway Ashley N
Current Estimated Value
Purchase Details
Closed on
Apr 20, 2012
Sold by
Marion County Board Of Commissioners Cit
Bought by
Conway Mark A
Purchase Details
Closed on
Apr 19, 2012
Sold by
Vogel Arvel
Bought by
County Of Marion
Purchase Details
Closed on
May 17, 2010
Sold by
Ferguson Neil
Bought by
Conway Mark A
Home Financials for this Owner
Home Financials are based on the most recent Mortgage that was taken out on this home.
Original Mortgage
$67,750
Interest Rate
4.86%
Mortgage Type
FHA
Purchase Details
Closed on
Oct 7, 2009
Sold by
Deutsche Bank National Trust Company
Bought by
Ferguson Neil
Purchase Details
Closed on
Jun 29, 2009
Sold by
Wrightsman Angela
Bought by
Deutsche Bank National Trust Company
Purchase Details
Closed on
Jun 9, 2006
Sold by
Cornerstone Real Estate Llc
Bought by
Wrightsman Angela
Home Financials for this Owner
Home Financials are based on the most recent Mortgage that was taken out on this home.
Original Mortgage
$94,905
Interest Rate
8.55%
Mortgage Type
Adjustable Rate Mortgage/ARM
Purchase Details
Closed on
May 22, 2006
Sold by
Blankenship Arthur L and Estate Of Mary Blankenship
Bought by
Cornerstone Real Estate Llc
Home Financials for this Owner
Home Financials are based on the most recent Mortgage that was taken out on this home.
Original Mortgage
$94,905
Interest Rate
8.55%
Mortgage Type
Adjustable Rate Mortgage/ARM
Purchase Details
Closed on
Jan 3, 2006
Sold by
Blankenship Arthur L and Estate Of Mary Blankenship
Bought by
Real Estate Llc
Home Financials for this Owner
Home Financials are based on the most recent Mortgage that was taken out on this home.
Original Mortgage
$1,500,000
Interest Rate
5.71%
Mortgage Type
Credit Line Revolving
Create a Home Valuation Report for This Property
The Home Valuation Report is an in-depth analysis detailing your home's value as well as a comparison with similar homes in the area
Home Values in the Area
Average Home Value in this Area
Purchase History
| Date | Buyer | Sale Price | Title Company |
|---|---|---|---|
| Conway Mark A | -- | None Available | |
| Conway Mark A | $500 | None Available | |
| County Of Marion | $1,579 | None Available | |
| Conway Mark A | -- | Investors Titlecorp | |
| Ferguson Neil | -- | None Available | |
| Deutsche Bank National Trust Company | $65,000 | None Available | |
| Wrightsman Angela | -- | None Available | |
| Cornerstone Real Estate Llc | -- | None Available | |
| Real Estate Llc | -- | None Available |
Source: Public Records
Mortgage History
| Date | Status | Borrower | Loan Amount |
|---|---|---|---|
| Previous Owner | Conway Mark A | $67,750 | |
| Previous Owner | Wrightsman Angela | $94,905 | |
| Previous Owner | Real Estate Llc | $1,500,000 |
Source: Public Records
Tax History
| Year | Tax Paid | Tax Assessment Tax Assessment Total Assessment is a certain percentage of the fair market value that is determined by local assessors to be the total taxable value of land and additions on the property. | Land | Improvement |
|---|---|---|---|---|
| 2025 | $2,108 | $203,100 | $53,300 | $149,800 |
| 2024 | $2,044 | $180,000 | $53,300 | $126,700 |
| 2023 | $2,044 | $167,300 | $53,300 | $114,000 |
| 2022 | $1,913 | $154,500 | $53,300 | $101,200 |
| 2021 | $1,572 | $129,400 | $53,300 | $76,100 |
| 2020 | $1,463 | $122,300 | $53,300 | $69,000 |
| 2019 | $834 | $87,900 | $22,200 | $65,700 |
| 2018 | $1,000 | $95,500 | $22,200 | $73,300 |
| 2017 | $759 | $88,000 | $22,200 | $65,800 |
| 2016 | $689 | $86,100 | $22,200 | $63,900 |
| 2014 | $586 | $82,300 | $22,200 | $60,100 |
| 2013 | $1,063 | $108,500 | $22,200 | $86,300 |
Source: Public Records
Map
Nearby Homes
- 1321 S Edgecombe Ave
- 1425 Edgecombe Ave
- 1620 Norton Ave
- 1228 E Perry St
- 3612 S State Ave
- 3149 Carson Ave
- 1120 Bacon St
- 1152 Knox St
- 800 E Werges Ave
- 770 E Werges Ave
- 1228 Knox St
- 3742 S Walcott St
- 3863 Asbury St
- 1802 Martin St
- 1018 Albany St
- 1218 E Edwards Ave
- 3401 S New Jersey St
- 3045 Asbury St
- 3033 Asbury St
- 1437 E Edwards Ave
- 1246 Edgecombe Ave
- 1250 Edgecombe Ave
- 1201 E Sumner Ave
- 1209 E Sumner Ave
- 1163 E Sumner Ave
- 1227 E Sumner Ave
- 1243 Edgecombe Ave
- 1159 E Sumner Ave
- 1124 Edgecombe Ave
- 1255 E Sumner Ave
- 1124 S Edgecombe Ave
- 1133 Edgecombe Ave
- 1243 S Edgecombe Ave
- 1304 Edgecombe Ave
- 1304 S Edgecombe Ave
- 1306 Edgecombe Ave
- 1305 E Sumner Ave
- 1123 Edgecombe Ave
- 1296 E Sumner Ave
Your Personal Tour Guide
Ask me questions while you tour the home.