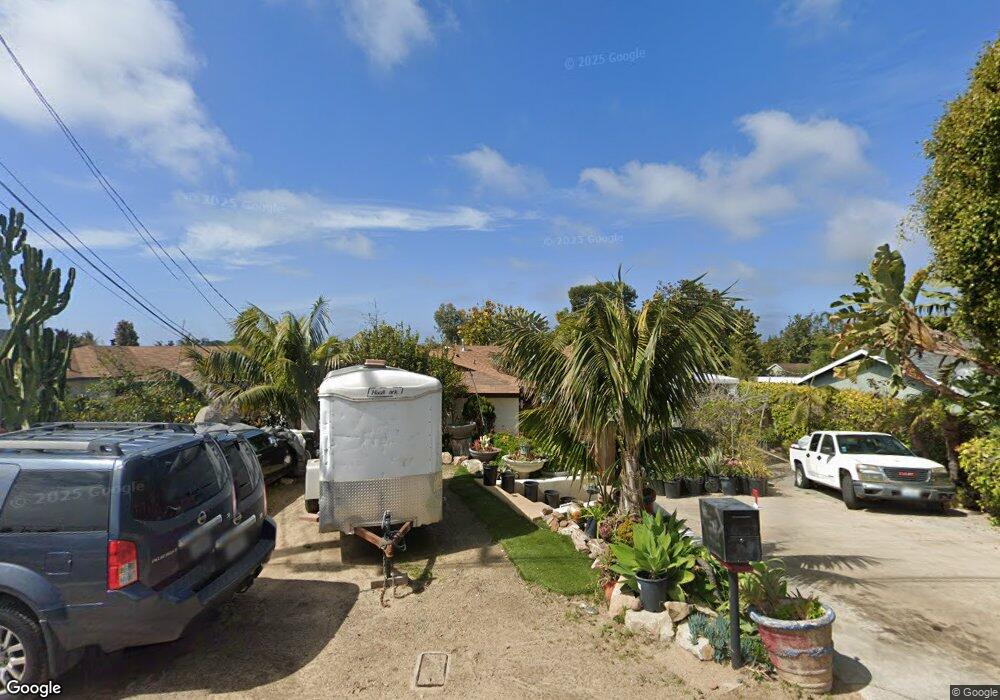
1142 Nardo Rd Encinitas, CA 92024
Central Encinitas NeighborhoodEstimated Value: $1,866,000 - $2,628,000
5
Beds
3
Baths
2,452
Sq Ft
$918/Sq Ft
Est. Value
About This Home
This home is located at 1142 Nardo Rd, Encinitas, CA 92024 and is currently estimated at $2,250,481, approximately $917 per square foot. 1142 Nardo Rd is a home located in San Diego County with nearby schools including Ocean Knoll Elementary School, Oak Crest Middle School, and La Costa Canyon High School.
Ownership History
Date
Name
Owned For
Owner Type
Purchase Details
Closed on
Jun 26, 2024
Sold by
Donnally Estela
Bought by
Donnally Bruce E
Current Estimated Value
Purchase Details
Closed on
May 15, 2024
Sold by
Donnally Estela
Bought by
Estela Donnally Trust and Donnally
Purchase Details
Closed on
Apr 22, 2013
Sold by
Donnally Estela and Donnally Bruce E
Bought by
Donnally Bruce E and Donnally Estela
Home Financials for this Owner
Home Financials are based on the most recent Mortgage that was taken out on this home.
Original Mortgage
$102,000
Interest Rate
3.6%
Mortgage Type
New Conventional
Purchase Details
Closed on
Aug 18, 2012
Sold by
Donnally Estela
Bought by
Donnally Estella and Donally Bruce E
Create a Home Valuation Report for This Property
The Home Valuation Report is an in-depth analysis detailing your home's value as well as a comparison with similar homes in the area
Home Values in the Area
Average Home Value in this Area
Purchase History
| Date | Buyer | Sale Price | Title Company |
|---|---|---|---|
| Donnally Bruce E | -- | None Listed On Document | |
| Estela Donnally Trust | -- | None Listed On Document | |
| Donnally Bruce E | -- | Lawyers Title Sd | |
| Donnally Estella | -- | None Available |
Source: Public Records
Mortgage History
| Date | Status | Borrower | Loan Amount |
|---|---|---|---|
| Previous Owner | Donnally Bruce E | $102,000 |
Source: Public Records
Tax History
| Year | Tax Paid | Tax Assessment Tax Assessment Total Assessment is a certain percentage of the fair market value that is determined by local assessors to be the total taxable value of land and additions on the property. | Land | Improvement |
|---|---|---|---|---|
| 2025 | $2,964 | $794,810 | $611,305 | $183,505 |
| 2024 | $2,964 | $136,886 | $22,169 | $114,717 |
| 2023 | $2,790 | $134,203 | $21,735 | $112,468 |
| 2022 | $2,838 | $131,572 | $21,309 | $110,263 |
| 2021 | $3,479 | $128,993 | $20,892 | $108,101 |
| 2020 | $3,226 | $127,671 | $20,678 | $106,993 |
| 2019 | $3,197 | $125,169 | $20,273 | $104,896 |
| 2018 | $3,648 | $122,716 | $19,876 | $102,840 |
| 2017 | $3,452 | $120,311 | $19,487 | $100,824 |
| 2016 | $3,268 | $117,953 | $19,105 | $98,848 |
| 2015 | $3,220 | $116,183 | $18,819 | $97,364 |
| 2014 | $3,173 | $113,908 | $18,451 | $95,457 |
Source: Public Records
Map
Nearby Homes
- 1009 Arcadia Rd
- 1428 Mackinnon Ave
- 917 Santo Way
- 1503 Villa Cardiff Dr
- 407 Requeza St Unit E9
- 760 Bonita Dr
- 664 Sea Ridge Ct
- 1180 Devonshire Dr
- 1011 Monterey Vista Way
- 1025 Monterey Vista Way
- 823 Stratford Dr
- 1089 Woodlake Dr
- 1010 Scarlet Way
- 926 Nolbey St
- 935 Encinitas Blvd
- 1632 Brahms Rd
- 1386 Lake Dr
- 1280 Santa fe Dr
- 545 Quail Pointe Ln
- 554 & 556 Stratford Dr
- 1132 Nardo Rd
- 1154 Nardo Rd
- 1164 Nardo Rd
- 1124 Nardo Rd
- 1145 Arcadia Rd
- 1133 Arcadia Rd
- 1155 Arcadia Rd
- 1155-57 Arcadia Rd
- 1176 Nardo Rd
- 1125-27 Arcadia Rd
- 1125 -1127 Arcadia Rd
- 1125 Arcadia Rd Unit 27
- 1116 Nardo Rd
- 1163 Arcadia Rd
- 1117 Arcadia Rd
- 1171 Arcadia Rd
- 1108 Nardo Rd
- 692 Santa fe Dr
- 680 Santa fe Dr
- 1109 Arcadia Rd
Your Personal Tour Guide
Ask me questions while you tour the home.