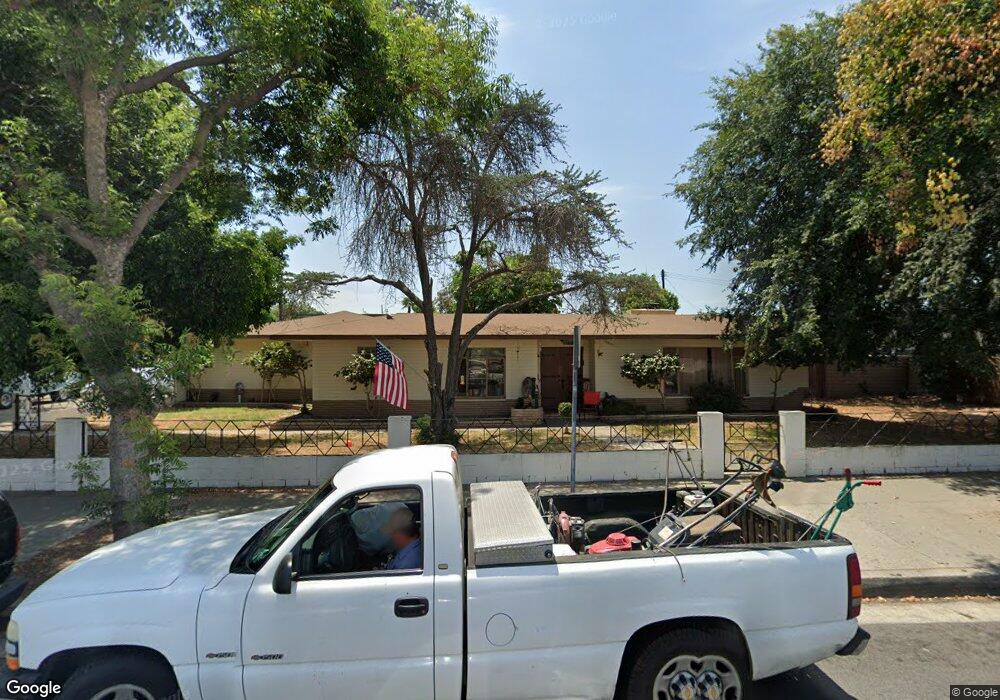
11422 Joslin St Santa Fe Springs, CA 90670
Estimated Value: $875,000 - $1,031,069
3
Beds
2
Baths
2,132
Sq Ft
$438/Sq Ft
Est. Value
About This Home
This home is located at 11422 Joslin St, Santa Fe Springs, CA 90670 and is currently estimated at $934,767, approximately $438 per square foot. 11422 Joslin St is a home located in Los Angeles County with nearby schools including Lakeview Elementary School, Lake Center Middle School, and Santa Fe High School.
Ownership History
Date
Name
Owned For
Owner Type
Purchase Details
Closed on
Aug 15, 2012
Sold by
Meraz Mike and Meraz Family Trust
Bought by
Meraz Mike
Current Estimated Value
Home Financials for this Owner
Home Financials are based on the most recent Mortgage that was taken out on this home.
Original Mortgage
$103,000
Interest Rate
3.53%
Mortgage Type
New Conventional
Purchase Details
Closed on
Feb 25, 2009
Sold by
Meraz Mike and Meraz Mike P
Bought by
Meraz Mike and The Meraz Family Trust
Purchase Details
Closed on
Dec 17, 2008
Sold by
Meraz Mike and Meraz Mike P
Bought by
Meraz Mike and The Meraz Family Trust
Purchase Details
Closed on
Oct 23, 1998
Sold by
Meraz Nancy
Bought by
Meraz Mike P
Home Financials for this Owner
Home Financials are based on the most recent Mortgage that was taken out on this home.
Original Mortgage
$136,500
Interest Rate
6.6%
Create a Home Valuation Report for This Property
The Home Valuation Report is an in-depth analysis detailing your home's value as well as a comparison with similar homes in the area
Home Values in the Area
Average Home Value in this Area
Purchase History
| Date | Buyer | Sale Price | Title Company |
|---|---|---|---|
| Meraz Mike | -- | Lsi Title | |
| Meraz Mike | -- | None Available | |
| Meraz Mike | -- | None Available | |
| Meraz Mike P | -- | Southland Title |
Source: Public Records
Mortgage History
| Date | Status | Borrower | Loan Amount |
|---|---|---|---|
| Closed | Meraz Mike | $103,000 | |
| Closed | Meraz Mike P | $136,500 |
Source: Public Records
Tax History Compared to Growth
Tax History
| Year | Tax Paid | Tax Assessment Tax Assessment Total Assessment is a certain percentage of the fair market value that is determined by local assessors to be the total taxable value of land and additions on the property. | Land | Improvement |
|---|---|---|---|---|
| 2025 | $3,124 | $182,346 | $85,752 | $96,594 |
| 2024 | $3,124 | $178,771 | $84,071 | $94,700 |
| 2023 | $3,061 | $175,267 | $82,423 | $92,844 |
| 2022 | $2,982 | $171,831 | $80,807 | $91,024 |
| 2021 | $2,842 | $168,463 | $79,223 | $89,240 |
| 2019 | $2,789 | $163,468 | $76,874 | $86,594 |
| 2018 | $2,558 | $160,264 | $75,367 | $84,897 |
| 2016 | $2,431 | $154,043 | $72,442 | $81,601 |
| 2015 | $2,364 | $151,730 | $71,354 | $80,376 |
| 2014 | $2,366 | $148,759 | $69,957 | $78,802 |
Source: Public Records
Map
Nearby Homes
- 11544 Promenade Dr
- 10350 Harvest Ave
- 10003 Aspen Cir
- 11032 Davenrich St
- 9871 Alburtis Ave Unit 38
- 9861 Alburtis Ave Unit 25
- 9927 Cedardale Dr
- 9813 Houghton Ave
- 11418 Flossmoor Rd
- 9760 Jersey Ave Unit 173
- 11744 Glenworth St
- 11733 Florence Ave
- 11733 Florence Ave Unit 1
- 11739 Florence Ave
- 9720 Blandwood Rd
- 9430 True Ave
- 8849 Pico Vista Rd
- Plan 4 at Aspire
- Plan 1 at Aspire
- Plan 2 at Aspire
- 11431 Joslin St
- 11417 Joslin St
- 10150 Summer Ave
- 10151 Summer Ave
- 11445 Joslin St
- 10156 Orr And Day Rd
- 10151 Gard Ave
- 10146 Summer Ave
- 10145 Summer Ave
- 10152 Orr And Day Rd
- 10147 Gard Ave
- 10146 Orr And Day Rd
- 10140 Summer Ave
- 10141 Summer Ave
- 11503 Joslin St
- 10141 Gard Ave
- 10140 Orr And Day Rd
- 10134 Summer Ave
- 10135 Summer Ave
- 10150 Gard Ave