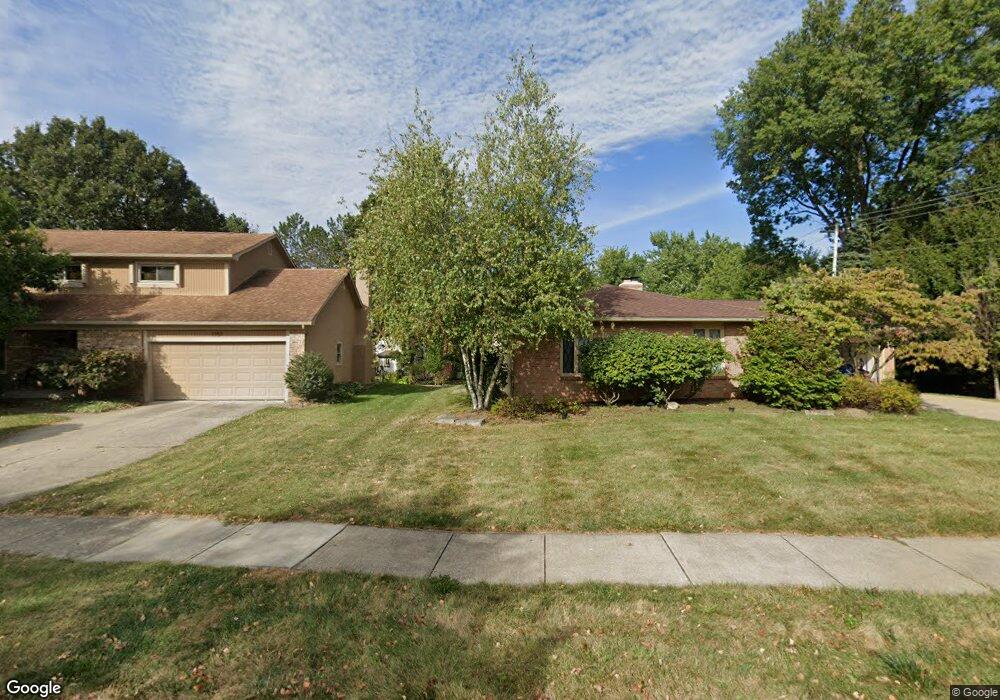
1143 Chatham Ridge Rd Westerville, OH 43081
Estimated Value: $425,000 - $453,000
3
Beds
2
Baths
1,858
Sq Ft
$236/Sq Ft
Est. Value
About This Home
This home is located at 1143 Chatham Ridge Rd, Westerville, OH 43081 and is currently estimated at $437,614, approximately $235 per square foot. 1143 Chatham Ridge Rd is a home located in Franklin County with nearby schools including Mcvay Elementary School, Walnut Springs Middle School, and Westerville-North High School.
Ownership History
Date
Name
Owned For
Owner Type
Purchase Details
Closed on
Sep 11, 2018
Bought by
Saunders Romey D Tr
Current Estimated Value
Purchase Details
Closed on
Jul 26, 2018
Bought by
Saunders Austin C Tr
Purchase Details
Closed on
Dec 17, 2009
Sold by
Dillard Lloyd P and Dillard Jean G
Bought by
Dillard Patricia A and The Dillard Keystone Inheritan
Purchase Details
Closed on
Sep 29, 1999
Sold by
Colacci Lawrence M and Colacci Barbara L
Bought by
Dillard Lloyd P and Dillard Jean G
Home Financials for this Owner
Home Financials are based on the most recent Mortgage that was taken out on this home.
Original Mortgage
$127,000
Interest Rate
7.37%
Purchase Details
Closed on
Oct 3, 1986
Bought by
Colacci Lawrence M
Purchase Details
Closed on
Mar 1, 1984
Create a Home Valuation Report for This Property
The Home Valuation Report is an in-depth analysis detailing your home's value as well as a comparison with similar homes in the area
Home Values in the Area
Average Home Value in this Area
Purchase History
| Date | Buyer | Sale Price | Title Company |
|---|---|---|---|
| Saunders Romey D Tr | -- | -- | |
| Saunders Austin C Tr | -- | -- | |
| Dillard Patricia A | -- | None Available | |
| Dillard Lloyd P | $128,000 | Chicago Title | |
| Colacci Lawrence M | $116,000 | -- | |
| -- | $95,000 | -- |
Source: Public Records
Mortgage History
| Date | Status | Borrower | Loan Amount |
|---|---|---|---|
| Previous Owner | Dillard Lloyd P | $127,000 |
Source: Public Records
Tax History Compared to Growth
Tax History
| Year | Tax Paid | Tax Assessment Tax Assessment Total Assessment is a certain percentage of the fair market value that is determined by local assessors to be the total taxable value of land and additions on the property. | Land | Improvement |
|---|---|---|---|---|
| 2024 | $6,602 | $125,970 | $33,250 | $92,720 |
| 2023 | $6,497 | $125,970 | $33,250 | $92,720 |
| 2022 | $5,998 | $91,080 | $23,140 | $67,940 |
| 2021 | $6,049 | $91,080 | $23,140 | $67,940 |
| 2020 | $6,031 | $91,080 | $23,140 | $67,940 |
| 2019 | $5,216 | $75,960 | $19,290 | $56,670 |
| 2018 | $4,998 | $75,960 | $19,290 | $56,670 |
| 2017 | $5,086 | $75,960 | $19,290 | $56,670 |
| 2016 | $5,042 | $68,890 | $21,530 | $47,360 |
| 2015 | $4,883 | $68,890 | $21,530 | $47,360 |
| 2014 | $4,887 | $68,890 | $21,530 | $47,360 |
| 2013 | $2,308 | $65,625 | $20,510 | $45,115 |
Source: Public Records
Map
Nearby Homes
- 1146 Forest Rise Dr
- 1209 Chatham Ridge Rd
- 1368 Nutmeg Ct
- 750 Autumn Branch Rd
- 613 Valley Wood Ct
- 737 Autumn Branch Rd
- 1003 Autumn Meadows Dr
- 1260 Autumn Park Ct
- 994 Autumn Lake Ct
- 969 Farrington Dr
- 640 Brook Run Dr
- 1201 Wallean Dr
- 800 S Spring Rd
- 90 Spring Creek Dr
- 806 Watten Ln
- 371 Delaware Dr
- 5769 Burntwood Way
- 810 Applewood Ln
- 461 Delaware Ct
- 326 Peachtree Ct Unit 326D
- 1151 Chatham Ridge Rd
- 629 Hackberry Dr
- 630 Northbridge Ct
- 621 Hackberry Dr
- 1159 Chatham Ridge Rd
- 600 Ipswich St
- 636 Northbridge Ct
- 1169 Laurel Dr
- 625 Northbridge Ct
- 1167 Chatham Ridge Rd
- 613 Hackberry Dr
- 603 Ipswich St
- 608 Ipswich St
- 644 Northbridge Ct
- 626 Hackberry Dr
- 1177 Laurel Dr
- 616 Hackberry Dr
- 1164 Laurel Dr
- 1175 Chatham Ridge Rd
- 1174 Chatham Ridge Rd