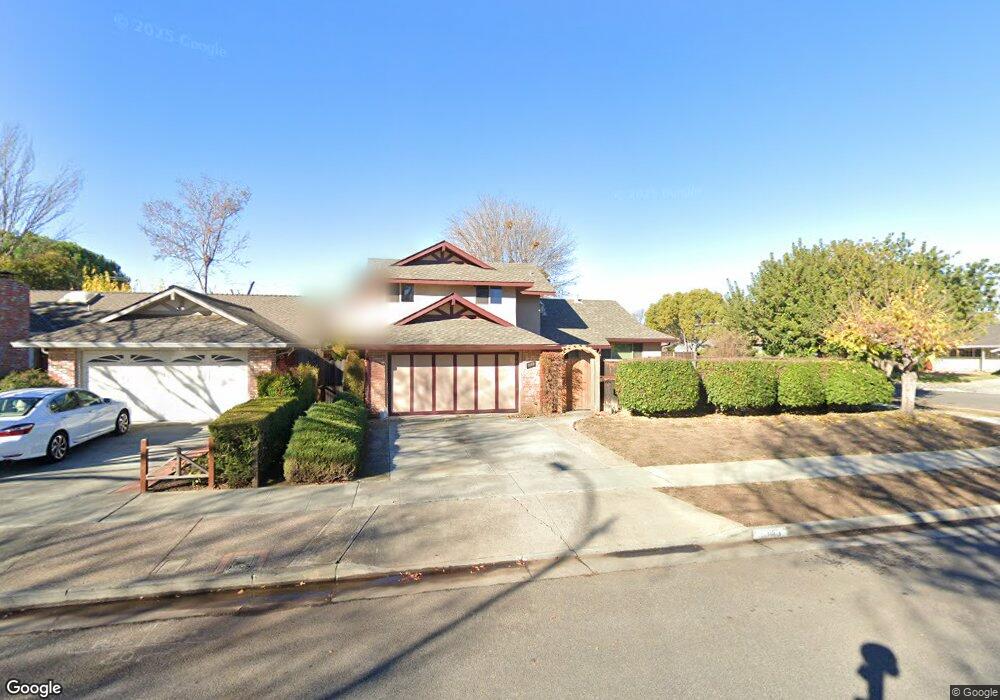
1143 Lockhaven Way San Jose, CA 95129
West San Jose NeighborhoodEstimated Value: $3,008,867 - $3,560,000
6
Beds
2
Baths
1,296
Sq Ft
$2,532/Sq Ft
Est. Value
About This Home
This home is located at 1143 Lockhaven Way, San Jose, CA 95129 and is currently estimated at $3,280,967, approximately $2,531 per square foot. 1143 Lockhaven Way is a home located in Santa Clara County with nearby schools including Nelson S. Dilworth Elementary School, Joaquin Miller Middle, and Lynbrook High School.
Ownership History
Date
Name
Owned For
Owner Type
Purchase Details
Closed on
Mar 28, 2016
Sold by
Chiang Scott C and Chiang Tsu Rong C
Bought by
Chiang Family Trust and Chiang Tsu Rong C
Current Estimated Value
Create a Home Valuation Report for This Property
The Home Valuation Report is an in-depth analysis detailing your home's value as well as a comparison with similar homes in the area
Home Values in the Area
Average Home Value in this Area
Purchase History
| Date | Buyer | Sale Price | Title Company |
|---|---|---|---|
| Chiang Family Trust | -- | None Available | |
| Chiang Scott C | -- | None Available |
Source: Public Records
Tax History Compared to Growth
Tax History
| Year | Tax Paid | Tax Assessment Tax Assessment Total Assessment is a certain percentage of the fair market value that is determined by local assessors to be the total taxable value of land and additions on the property. | Land | Improvement |
|---|---|---|---|---|
| 2025 | $7,755 | $545,013 | $239,252 | $305,761 |
| 2024 | $7,755 | $534,327 | $234,561 | $299,766 |
| 2023 | $7,632 | $523,851 | $229,962 | $293,889 |
| 2022 | $7,479 | $513,580 | $225,453 | $288,127 |
| 2021 | $7,328 | $503,511 | $221,033 | $282,478 |
| 2020 | $7,159 | $498,349 | $218,767 | $279,582 |
| 2019 | $6,987 | $488,578 | $214,478 | $274,100 |
| 2018 | $6,783 | $478,999 | $210,273 | $268,726 |
| 2017 | $6,739 | $469,607 | $206,150 | $263,457 |
| 2016 | $6,869 | $460,400 | $202,108 | $258,292 |
| 2015 | $6,819 | $453,486 | $199,073 | $254,413 |
| 2014 | $6,232 | $444,604 | $195,174 | $249,430 |
Source: Public Records
Map
Nearby Homes
- 5597 Glenoak Ct
- 6117 Brigantine Dr
- 1063 Whitebick Dr
- 5688 Kimberly St
- 1018 Huntingdon Dr
- 18980 Newsom Ave
- 10860 Johnson Ave
- 1002 Oaktree Dr
- 1083 Miller Ave
- 1154 Bentoak Ln
- 5635 W Walbrook Dr
- 915 S Tantau Ave
- 1017 Craig Dr
- 1367 Cordelia Ave
- 18901 Tuggle Ave
- 18817 Tuggle Ave
- 5187 Doyle Rd
- 12035 Brookglen Dr
- 5177 Englewood Dr
- 19251 Phil Ln
- 1147 Lockhaven Way
- 1132 Fairford Way
- 1151 Lockhaven Way
- 1136 Fairford Way
- 5903 Friar Way
- 5915 Friar Way
- 5895 Friar Way
- 1146 Lockhaven Way
- 1142 Lockhaven Way
- 1140 Fairford Way
- 5927 Friar Way
- 1155 Lockhaven Way
- 1150 Lockhaven Way
- 5883 Friar Way
- 5939 Friar Way
- 1154 Lockhaven Way
- 1144 Fairford Way
- 5875 Friar Way
- 1159 Lockhaven Way
- 1153 Johnson Ave