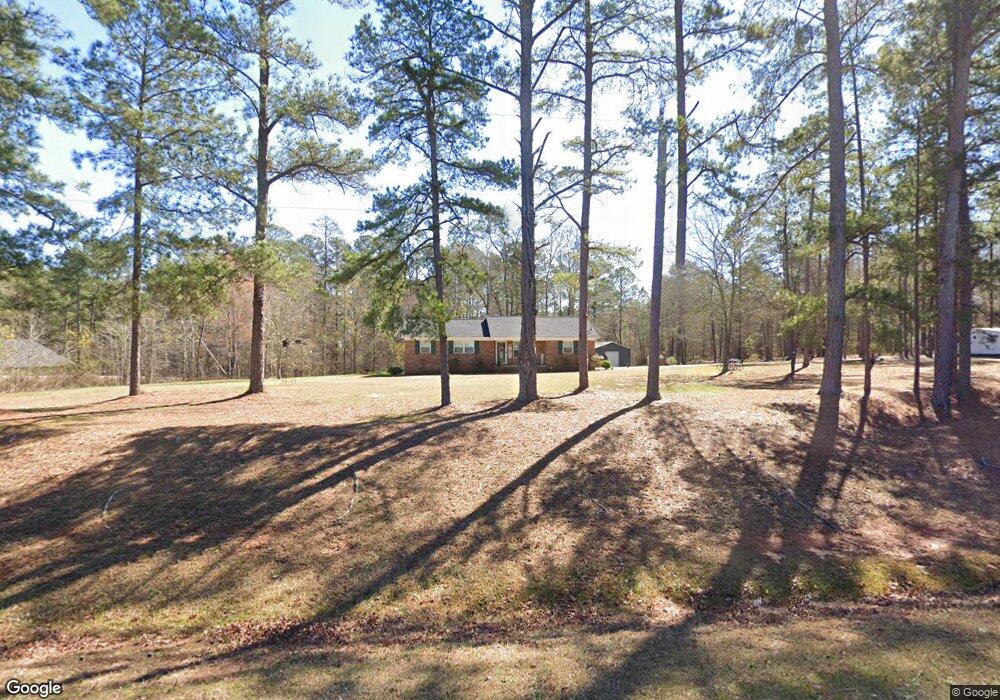
1143 Maxim Rd Lincolnton, GA 30817
Estimated Value: $196,630 - $267,000
3
Beds
2
Baths
1,247
Sq Ft
$187/Sq Ft
Est. Value
About This Home
This home is located at 1143 Maxim Rd, Lincolnton, GA 30817 and is currently estimated at $233,408, approximately $187 per square foot. 1143 Maxim Rd is a home located in Lincoln County with nearby schools including Lincoln County Elementary School, Lincoln County Middle School, and Lincoln County High School.
Ownership History
Date
Name
Owned For
Owner Type
Purchase Details
Closed on
Sep 28, 2020
Sold by
Spires Charles William
Bought by
Shannon Edward D and Shannon Roxanne Lee
Current Estimated Value
Home Financials for this Owner
Home Financials are based on the most recent Mortgage that was taken out on this home.
Original Mortgage
$128,250
Outstanding Balance
$113,555
Interest Rate
2.9%
Mortgage Type
New Conventional
Estimated Equity
$119,853
Purchase Details
Closed on
Nov 8, 2013
Sold by
Goolsby Horace
Bought by
Spires Charles W
Home Financials for this Owner
Home Financials are based on the most recent Mortgage that was taken out on this home.
Original Mortgage
$13,500
Interest Rate
4.26%
Mortgage Type
New Conventional
Purchase Details
Closed on
May 29, 1970
Sold by
Bohler Lloyd E
Bought by
Goolsby Kenneth Etal
Purchase Details
Closed on
May 23, 1960
Bought by
Bohler Lloyd E
Create a Home Valuation Report for This Property
The Home Valuation Report is an in-depth analysis detailing your home's value as well as a comparison with similar homes in the area
Home Values in the Area
Average Home Value in this Area
Purchase History
| Date | Buyer | Sale Price | Title Company |
|---|---|---|---|
| Shannon Edward D | $135,000 | -- | |
| Spires Charles W | $15,000 | -- | |
| Goolsby Kenneth Etal | -- | -- | |
| Bohler Lloyd E | -- | -- |
Source: Public Records
Mortgage History
| Date | Status | Borrower | Loan Amount |
|---|---|---|---|
| Open | Shannon Edward D | $128,250 | |
| Previous Owner | Spires Charles W | $13,500 |
Source: Public Records
Tax History Compared to Growth
Tax History
| Year | Tax Paid | Tax Assessment Tax Assessment Total Assessment is a certain percentage of the fair market value that is determined by local assessors to be the total taxable value of land and additions on the property. | Land | Improvement |
|---|---|---|---|---|
| 2025 | $1,483 | $48,560 | $5,200 | $43,360 |
| 2024 | $1,414 | $45,240 | $4,960 | $40,280 |
| 2023 | $916 | $34,840 | $3,920 | $30,920 |
| 2022 | $1,058 | $33,560 | $3,920 | $29,640 |
| 2021 | $1,055 | $30,320 | $3,400 | $26,920 |
| 2020 | $956 | $24,760 | $3,400 | $21,360 |
| 2019 | $958 | $24,760 | $3,400 | $21,360 |
| 2018 | $1,106 | $35,200 | $3,400 | $31,800 |
| 2017 | $243 | $7,720 | $4,280 | $3,440 |
| 2016 | $418 | $7,720 | $4,280 | $3,440 |
| 2015 | -- | $7,720 | $4,280 | $3,440 |
| 2014 | -- | $7,720 | $4,280 | $3,440 |
| 2013 | -- | $7,720 | $4,280 | $3,440 |
Source: Public Records
Map
Nearby Homes
- 9-3 Long Cove
- 7-3 Long Cove
- 1-3 Long Cove Dr
- 6-3 Long Cove Dr
- 8-3 Long Cove Dr
- 5-3 Long Cove Dr
- 4-3 Long Cove Dr
- 3-3 Long Cove Dr
- 2-3 Long Cove Dr
- 1080 Serenity Pointe Dr
- 1051 Lake Dr
- 1085 Lake Dr
- 1016 Hidden Lake Ct
- Lot 6 Lighthouse Point
- 0 Hwy 220 Unit 538782
- Lot 14 Wisteria Dr
- 1036 Longleaf Way
- 1203 Price Reese Rd
- 1164 Sally Ann Ct
- 1063 Fleming Lk Ct
- 1160 Maxim Rd
- 1099 Maxim Rd
- 1210 Maxim Rd
- 1200 Maxim Rd
- 3644 Double Branches Rd
- 1185 Maxim Rd
- 3606 Double Branches Rd
- 1187 Maxim Rd
- 3546 Double Branches Rd
- 1227 Maxim Rd
- 8.77 Maxim Rd
- 9.43 Maxim Rd
- 3710 Double Branches Rd
- 3555 Double Branches Rd
- 3467 Double Branches Rd
- 00 E Highway 220
- 4449 Ga Highway 220 E
- 4458 Ga Highway 220 E
- 3764 Double Branches Rd
- 4322 Ga Highway 220 E