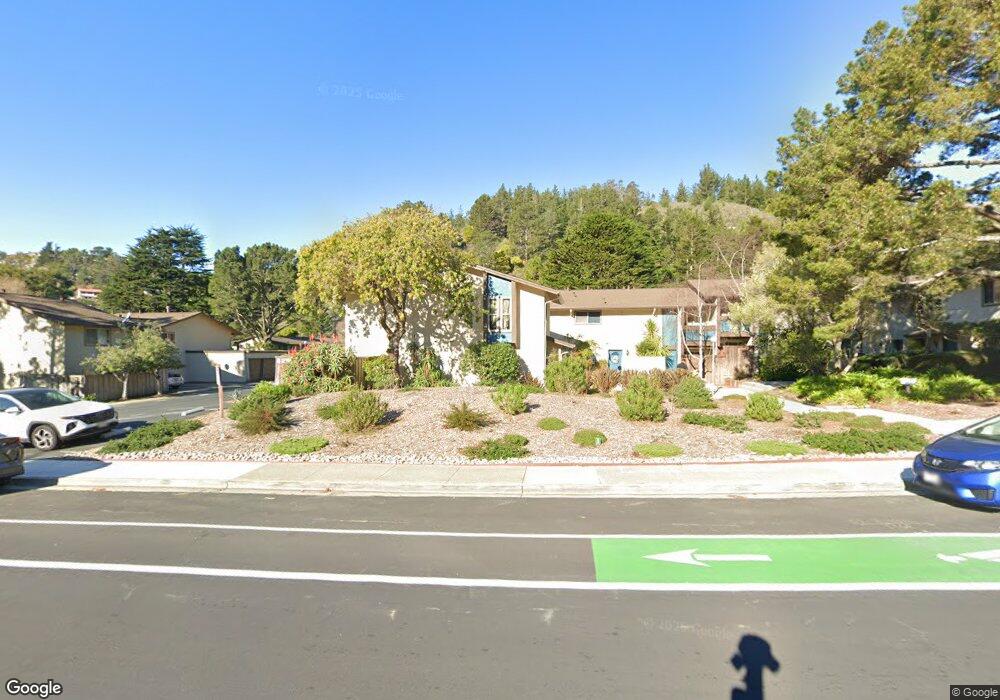
1143 Oddstad Blvd Pacifica, CA 94044
Fairway Park NeighborhoodEstimated Value: $712,000 - $798,973
2
Beds
2
Baths
940
Sq Ft
$813/Sq Ft
Est. Value
About This Home
This home is located at 1143 Oddstad Blvd, Pacifica, CA 94044 and is currently estimated at $763,993, approximately $812 per square foot. 1143 Oddstad Blvd is a home located in San Mateo County with nearby schools including Cabrillo Elementary School, Vallemar Elementary School, and Ocean Shore Elementary School.
Ownership History
Date
Name
Owned For
Owner Type
Purchase Details
Closed on
Jan 29, 2021
Sold by
Devincenzi Lea
Bought by
Devincenzi Ann
Current Estimated Value
Purchase Details
Closed on
Mar 4, 2013
Sold by
Devincenzi Ann and Black Ann L
Bought by
Devincenzi Richard and Devincenzi Lea
Purchase Details
Closed on
Feb 11, 2013
Sold by
Black Todd
Bought by
Black Ann L and Black Ann Devincenzi
Purchase Details
Closed on
Mar 7, 1997
Sold by
Mccarroll David Francis
Bought by
Black Todd and Black Ann L
Home Financials for this Owner
Home Financials are based on the most recent Mortgage that was taken out on this home.
Original Mortgage
$157,225
Interest Rate
7%
Purchase Details
Closed on
Aug 7, 1995
Sold by
Mccarroll Carolyn
Bought by
Mccarroll David Francis
Home Financials for this Owner
Home Financials are based on the most recent Mortgage that was taken out on this home.
Original Mortgage
$15,000
Interest Rate
7.61%
Create a Home Valuation Report for This Property
The Home Valuation Report is an in-depth analysis detailing your home's value as well as a comparison with similar homes in the area
Home Values in the Area
Average Home Value in this Area
Purchase History
| Date | Buyer | Sale Price | Title Company |
|---|---|---|---|
| Devincenzi Ann | -- | None Available | |
| Devincenzi Richard | $154,000 | Old Republic Title Company | |
| Black Ann L | -- | Old Republic Title Company | |
| Black Todd | $165,500 | Commonwealth Land Title Co | |
| Mccarroll David Francis | -- | First American Title Co |
Source: Public Records
Mortgage History
| Date | Status | Borrower | Loan Amount |
|---|---|---|---|
| Previous Owner | Black Todd | $157,225 | |
| Previous Owner | Mccarroll David Francis | $15,000 |
Source: Public Records
Tax History
| Year | Tax Paid | Tax Assessment Tax Assessment Total Assessment is a certain percentage of the fair market value that is determined by local assessors to be the total taxable value of land and additions on the property. | Land | Improvement |
|---|---|---|---|---|
| 2025 | $4,354 | $269,514 | $134,757 | $134,757 |
| 2023 | $4,354 | $259,050 | $129,525 | $129,525 |
| 2022 | $3,959 | $253,972 | $126,986 | $126,986 |
| 2021 | $3,903 | $248,994 | $124,497 | $124,497 |
| 2020 | $3,912 | $246,442 | $123,221 | $123,221 |
| 2019 | $3,804 | $241,610 | $120,805 | $120,805 |
| 2018 | $3,598 | $236,874 | $118,437 | $118,437 |
| 2017 | $3,468 | $232,230 | $116,115 | $116,115 |
| 2016 | $3,359 | $227,678 | $113,839 | $113,839 |
| 2015 | $3,222 | $224,260 | $112,130 | $112,130 |
| 2014 | $3,260 | $219,868 | $109,934 | $109,934 |
Source: Public Records
Map
Nearby Homes
- 1181 Oddstad Blvd
- 1039 Oddstad Blvd
- 1100 Glacier Ave
- 1155 Grand Teton Dr
- 1102 Everglades Dr
- 0 Everglades Dr
- 602 Big Bend Dr
- 1050 Yosemite Dr
- 800 Oddstad Blvd
- 1358 Terra Nova Blvd
- 0 Spruce Ct
- 1176 Alicante Dr
- 0 Oddstad Blvd
- 1135 Valencia Way
- 2 Celia Ct
- 0 Calera Terrace Unit ML82039911
- 0 Calera Terrace Unit ML82028895
- 0 Calera Terrace Unit ML82040433
- 1372 Alicante Dr
- 827 Fassler Ave
- 1145 Oddstad Blvd
- 1147 Oddstad Blvd
- 1141 Oddstad Blvd
- 1149 Oddstad Blvd
- 1151 Oddstad Blvd
- 1139 Oddstad Blvd
- 1153 Oddstad Blvd
- 1137 Oddstad Blvd
- 1155 Oddstad Blvd
- 1135 Oddstad Blvd
- 1203 Oddstad Blvd
- 1205 Oddstad Blvd
- 1131 Oddstad Blvd
- 1201 Oddstad Blvd
- 1199 Oddstad Blvd
- 1129 Oddstad Blvd
- 1197 Oddstad Blvd
- 1159 Oddstad Blvd
- 1127 Oddstad Blvd
- 1161 Oddstad Blvd
Your Personal Tour Guide
Ask me questions while you tour the home.