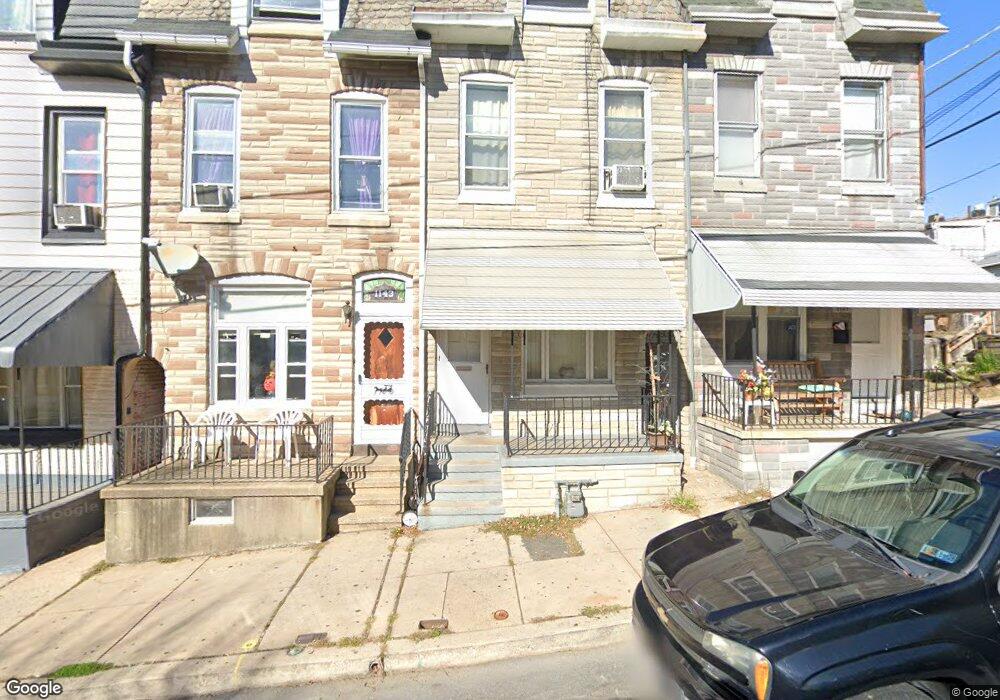
1143 Oley St Reading, PA 19604
District 6 NeighborhoodEstimated Value: $118,000 - $151,000
3
Beds
1
Bath
1,644
Sq Ft
$80/Sq Ft
Est. Value
About This Home
This home is located at 1143 Oley St, Reading, PA 19604 and is currently estimated at $131,000, approximately $79 per square foot. 1143 Oley St is a home located in Berks County with nearby schools including 13th & Green Elementary School, Central Middle School, and Reading Senior High School.
Ownership History
Date
Name
Owned For
Owner Type
Purchase Details
Closed on
Aug 7, 2020
Sold by
Schwager Alan L
Bought by
Antillana Realty Group
Current Estimated Value
Purchase Details
Closed on
Sep 12, 2006
Sold by
Schwager Alan L and Major Allen H
Bought by
Schwager Alan L
Create a Home Valuation Report for This Property
The Home Valuation Report is an in-depth analysis detailing your home's value as well as a comparison with similar homes in the area
Home Values in the Area
Average Home Value in this Area
Purchase History
| Date | Buyer | Sale Price | Title Company |
|---|---|---|---|
| Antillana Realty Group | $33,000 | Abes Abstract Llc | |
| Schwager Alan L | -- | None Available |
Source: Public Records
Tax History
| Year | Tax Paid | Tax Assessment Tax Assessment Total Assessment is a certain percentage of the fair market value that is determined by local assessors to be the total taxable value of land and additions on the property. | Land | Improvement |
|---|---|---|---|---|
| 2025 | $850 | $31,300 | $12,000 | $19,300 |
| 2024 | $1,390 | $31,300 | $12,000 | $19,300 |
| 2023 | $1,368 | $31,300 | $12,000 | $19,300 |
| 2022 | $1,368 | $31,300 | $12,000 | $19,300 |
| 2021 | $1,368 | $31,300 | $12,000 | $19,300 |
| 2020 | $1,355 | $31,300 | $12,000 | $19,300 |
| 2019 | $1,355 | $31,300 | $12,000 | $19,300 |
| 2018 | $1,355 | $31,300 | $12,000 | $19,300 |
| 2017 | $1,346 | $31,300 | $12,000 | $19,300 |
| 2016 | $769 | $31,300 | $12,000 | $19,300 |
| 2015 | $769 | $31,300 | $12,000 | $19,300 |
| 2014 | $707 | $31,300 | $12,000 | $19,300 |
Source: Public Records
Map
Nearby Homes
Your Personal Tour Guide
Ask me questions while you tour the home.