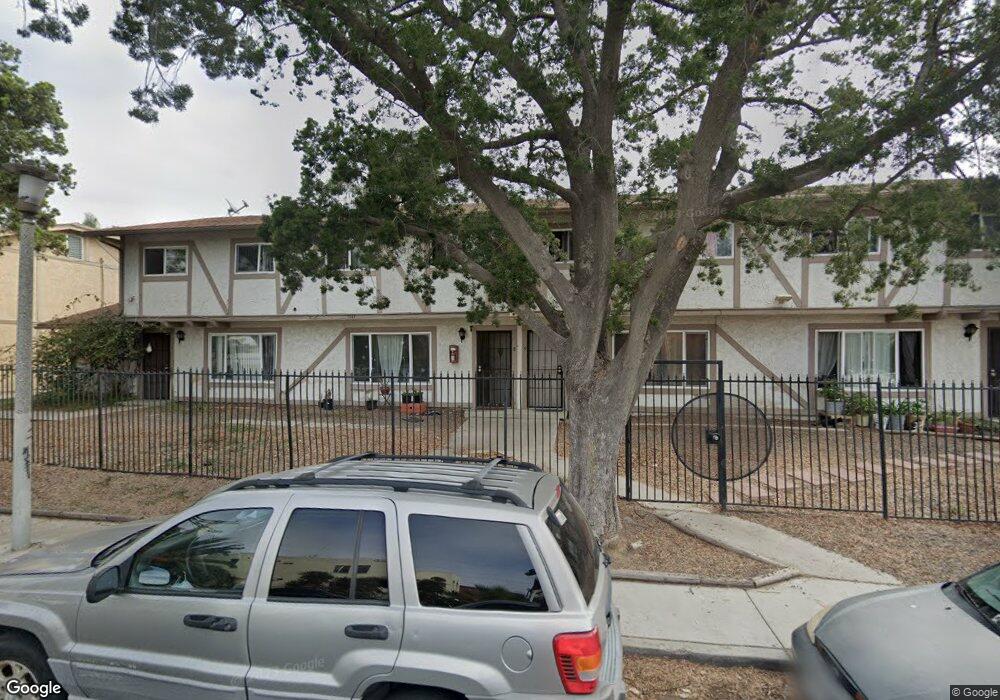
1143 S 41st St Unit 10 San Diego, CA 92113
Southcrest NeighborhoodEstimated Value: $395,000 - $502,000
3
Beds
2
Baths
1,240
Sq Ft
$368/Sq Ft
Est. Value
About This Home
This home is located at 1143 S 41st St Unit 10, San Diego, CA 92113 and is currently estimated at $456,664, approximately $368 per square foot. 1143 S 41st St Unit 10 is a home located in San Diego County with nearby schools including Baker Elementary School, Knox Middle, and Lincoln High School.
Ownership History
Date
Name
Owned For
Owner Type
Purchase Details
Closed on
Mar 28, 2014
Sold by
Joseph Melissa
Bought by
Joseph Melissa and Xue Dong L
Current Estimated Value
Purchase Details
Closed on
Apr 9, 2013
Sold by
Xue Dong L
Bought by
Joseph Melissa
Purchase Details
Closed on
Nov 8, 2010
Sold by
Enriquez Rafael and Batres Alicia
Bought by
Xue Dong L
Purchase Details
Closed on
Feb 1, 2007
Sold by
Sanchez Jesus
Bought by
Enriquez Rafael and Batnes Alicia
Home Financials for this Owner
Home Financials are based on the most recent Mortgage that was taken out on this home.
Original Mortgage
$306,000
Interest Rate
6.29%
Mortgage Type
Purchase Money Mortgage
Create a Home Valuation Report for This Property
The Home Valuation Report is an in-depth analysis detailing your home's value as well as a comparison with similar homes in the area
Home Values in the Area
Average Home Value in this Area
Purchase History
| Date | Buyer | Sale Price | Title Company |
|---|---|---|---|
| Joseph Melissa | -- | None Available | |
| Joseph Melissa | $90,000 | None Available | |
| Xue Dong L | $90,000 | Corinthian Title Company | |
| Enriquez Rafael | $306,000 | First American Title Co |
Source: Public Records
Mortgage History
| Date | Status | Borrower | Loan Amount |
|---|---|---|---|
| Previous Owner | Enriquez Rafael | $306,000 |
Source: Public Records
Tax History Compared to Growth
Tax History
| Year | Tax Paid | Tax Assessment Tax Assessment Total Assessment is a certain percentage of the fair market value that is determined by local assessors to be the total taxable value of land and additions on the property. | Land | Improvement |
|---|---|---|---|---|
| 2025 | $1,462 | $125,892 | $52,821 | $73,071 |
| 2024 | $1,462 | $123,425 | $51,786 | $71,639 |
| 2023 | $1,428 | $121,006 | $50,771 | $70,235 |
| 2022 | $1,388 | $118,634 | $49,776 | $68,858 |
| 2021 | $1,377 | $116,308 | $48,800 | $67,508 |
| 2020 | $1,360 | $115,116 | $48,300 | $66,816 |
| 2019 | $1,335 | $112,859 | $47,353 | $65,506 |
| 2018 | $1,264 | $110,647 | $46,425 | $64,222 |
| 2017 | $82 | $108,478 | $45,515 | $62,963 |
| 2016 | $1,277 | $106,352 | $44,623 | $61,729 |
| 2015 | $1,258 | $104,755 | $43,953 | $60,802 |
| 2014 | $1,028 | $90,408 | $41,186 | $49,222 |
Source: Public Records
Map
Nearby Homes
- 1149 S 41st St Unit 27
- 1107 S 41st St Unit 1
- 4064 National Ave
- 3979 Boston Ave
- 4300 Newton Ave Unit 31
- 4300 Newton Ave Unit 106
- 4300 Newton Ave Unit 45
- 4300 Newton Ave Unit 29
- 722 S 42nd St
- 4123 Gamma St Unit 27
- 4117 Jamul Ave
- 3964 Delta St
- 4029 Delta St
- 4096 Epsilon St
- 3770 National Ave Unit 2
- 431 Cuyamaca Ave
- 4402 Delta St Unit 23
- 3867 Teak St
- 812 West St
- 4188 Eta St
- 1149 S 41st St
- 1149 S 41st St Unit 26
- 1149 S 41st St Unit 25
- 1149 S 41st St Unit 24
- 1137 S 41st St Unit 23
- 1137 S 41st St Unit 22
- 1129 S 41st St Unit 21
- 1129 S 41st St Unit 20
- 1111 S 41st St Unit 19
- 1111 S 41st St Unit 18
- 1111 S 41st St Unit 17
- 1111 S 41st St Unit 16
- 1143 S 41st St Unit 9
- 1143 S 41st St Unit 8
- 1143 S 41st St Unit 7
- 1117 S 41st St Unit 6
- 1117 S 41st St Unit 5
- 1107 S 41st St
- 1107 S 41st St Unit 4
- 1107 S 41st St Unit 3