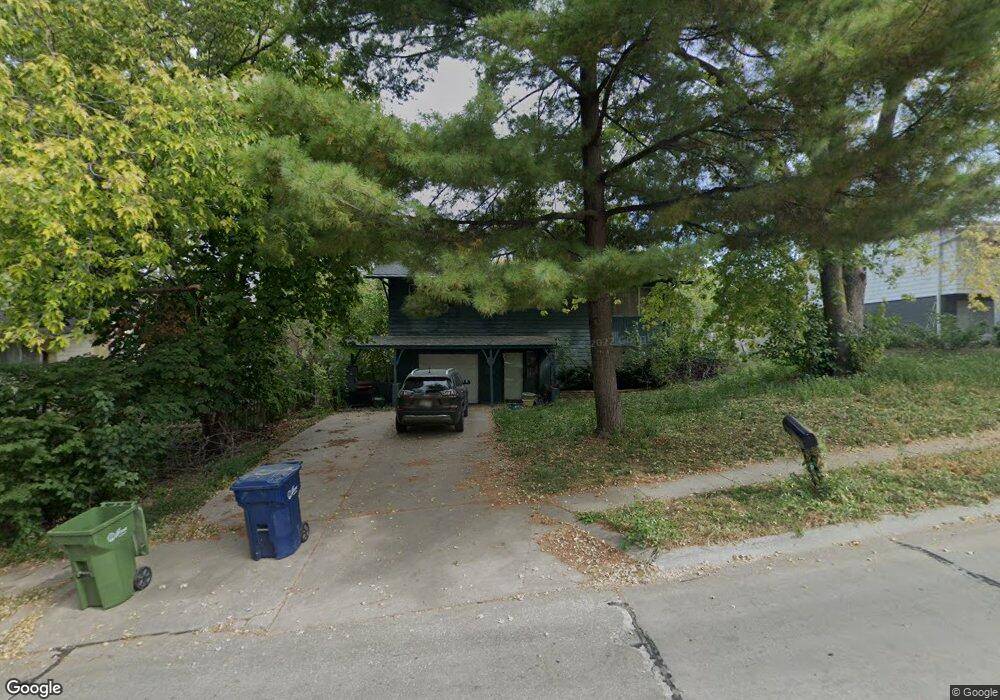
1143 Wilroy Rd Bellevue, NE 68005
Estimated Value: $222,000 - $284,000
3
Beds
4
Baths
1,680
Sq Ft
$143/Sq Ft
Est. Value
About This Home
This home is located at 1143 Wilroy Rd, Bellevue, NE 68005 and is currently estimated at $239,740, approximately $142 per square foot. 1143 Wilroy Rd is a home located in Sarpy County with nearby schools including Birchcrest Elementary School, Logan Fontenelle Middle School, and Bellevue East High School.
Ownership History
Date
Name
Owned For
Owner Type
Purchase Details
Closed on
Mar 19, 2024
Sold by
Meissner Ann
Bought by
Emmons Ann
Current Estimated Value
Purchase Details
Closed on
Jan 9, 2003
Sold by
Meissner Kenlyn and Haas Ann E
Bought by
Meissner Kenlyn and Meissner Ann
Home Financials for this Owner
Home Financials are based on the most recent Mortgage that was taken out on this home.
Original Mortgage
$89,729
Interest Rate
5.9%
Mortgage Type
FHA
Purchase Details
Closed on
Apr 4, 2000
Sold by
Freeman James R and Freeman Rhonda E
Bought by
Meissner Kenlyn R and Haas Ann E
Home Financials for this Owner
Home Financials are based on the most recent Mortgage that was taken out on this home.
Original Mortgage
$90,953
Interest Rate
8.24%
Mortgage Type
FHA
Create a Home Valuation Report for This Property
The Home Valuation Report is an in-depth analysis detailing your home's value as well as a comparison with similar homes in the area
Home Values in the Area
Average Home Value in this Area
Purchase History
| Date | Buyer | Sale Price | Title Company |
|---|---|---|---|
| Emmons Ann | -- | None Listed On Document | |
| Meissner Kenlyn | -- | -- | |
| Meissner Kenlyn R | $91,000 | -- |
Source: Public Records
Mortgage History
| Date | Status | Borrower | Loan Amount |
|---|---|---|---|
| Previous Owner | Meissner Kenlyn | $89,729 | |
| Previous Owner | Meissner Kenlyn R | $90,953 |
Source: Public Records
Tax History Compared to Growth
Tax History
| Year | Tax Paid | Tax Assessment Tax Assessment Total Assessment is a certain percentage of the fair market value that is determined by local assessors to be the total taxable value of land and additions on the property. | Land | Improvement |
|---|---|---|---|---|
| 2025 | $3,092 | $183,155 | $38,000 | $145,155 |
| 2024 | $3,288 | $176,208 | $34,000 | $142,208 |
| 2023 | $3,288 | $155,703 | $30,000 | $125,703 |
| 2022 | $2,964 | $137,727 | $27,000 | $110,727 |
| 2021 | $2,893 | $132,998 | $27,000 | $105,998 |
| 2020 | $2,713 | $124,336 | $21,000 | $103,336 |
| 2019 | $2,518 | $116,130 | $21,000 | $95,130 |
| 2018 | $2,489 | $117,877 | $21,000 | $96,877 |
| 2017 | $2,378 | $111,829 | $21,000 | $90,829 |
| 2016 | $2,288 | $110,003 | $21,000 | $89,003 |
| 2015 | $2,260 | $109,273 | $21,000 | $88,273 |
| 2014 | $2,246 | $107,878 | $21,000 | $86,878 |
| 2012 | -- | $106,870 | $21,000 | $85,870 |
Source: Public Records
Map
Nearby Homes
- 20.74 Acres
- 1302 Wilroy Rd Unit 1
- 1101 Potter Rd
- 1206 Skyview Dr
- 1101 Marian Ave
- 1212 W 16th Ave
- 910 Lemay Dr
- 1509 Brenda Dr
- 208 Sandi Ct
- 2113 Twinridge Dr
- 304 Marian Ave
- 2203 Lloyd St
- 1511 Lorraine Ave
- 901 Brenton Ave
- 2208 Greensboro Ave
- 1505 Mildred Ave
- 2108 Randall Dr
- 2212 Greensboro Ave
- 1219 Robin Dr
- 2303 Lloyd St
- 1137 Wilroy Rd
- 1211 Wilroy Rd
- 1142 Saint Andrews Rd
- 1144 Saint Andrews Rd
- 1129 Wilroy Rd
- 1213 Wilroy Rd
- 1136 Saint Andrews Rd
- 1146 Saint Andrews Rd
- 1212 Wilroy Rd
- 1144 Wilroy Rd
- 1214 Wilroy Rd
- 1130 Saint Andrews Rd
- 1138 Wilroy Rd
- 1215 Wilroy Rd
- 1123 Wilroy Rd
- 1214 Saint Andrews Rd
- 1214 St Andrews Rd
- 1216 Wilroy Rd
- 1130 Wilroy Rd
- 1102 Saint Andrews Rd