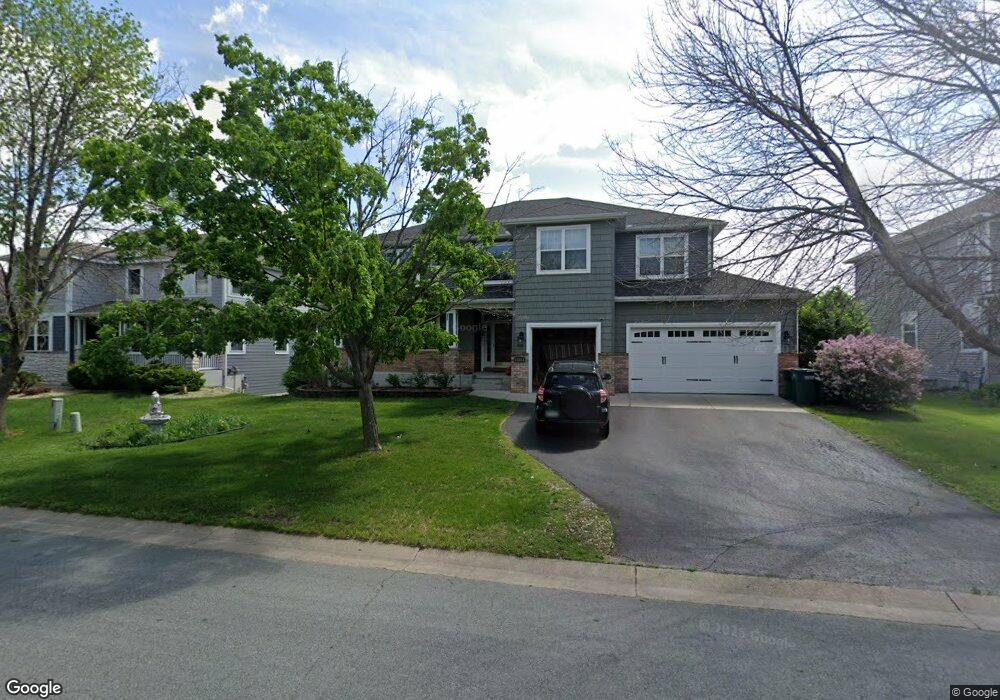
11431 Arnold Palmer Dr Minneapolis, MN 55449
Estimated Value: $627,000 - $781,000
4
Beds
4
Baths
4,962
Sq Ft
$141/Sq Ft
Est. Value
About This Home
This home is located at 11431 Arnold Palmer Dr, Minneapolis, MN 55449 and is currently estimated at $698,541, approximately $140 per square foot. 11431 Arnold Palmer Dr is a home located in Anoka County with nearby schools including Northpoint Elementary School, Westwood Intermediate and Middle School, and Innovation Science & Tech Academy.
Ownership History
Date
Name
Owned For
Owner Type
Purchase Details
Closed on
Aug 31, 2020
Sold by
Sheikhail Dahir and Ismail Ayan
Bought by
Shafiuddin Mohammed and Shafiuddin Hamiyath M
Current Estimated Value
Home Financials for this Owner
Home Financials are based on the most recent Mortgage that was taken out on this home.
Original Mortgage
$436,500
Outstanding Balance
$387,365
Interest Rate
2.9%
Mortgage Type
New Conventional
Estimated Equity
$311,176
Purchase Details
Closed on
Aug 26, 2016
Sold by
Backes Steven M and Backes Jacqueline L
Bought by
Sheikhali Dahie and Ismail Ayan
Home Financials for this Owner
Home Financials are based on the most recent Mortgage that was taken out on this home.
Original Mortgage
$235,000
Interest Rate
3.48%
Mortgage Type
New Conventional
Purchase Details
Closed on
May 31, 2000
Sold by
Town & Country Homes Inc
Bought by
Backes Steven M and Backes Jacqueline L
Create a Home Valuation Report for This Property
The Home Valuation Report is an in-depth analysis detailing your home's value as well as a comparison with similar homes in the area
Home Values in the Area
Average Home Value in this Area
Purchase History
| Date | Buyer | Sale Price | Title Company |
|---|---|---|---|
| Shafiuddin Mohammed | $485,000 | Title One Inc | |
| Sheikhali Dahie | $410,000 | Regency Title Inc | |
| Backes Steven M | $322,620 | -- |
Source: Public Records
Mortgage History
| Date | Status | Borrower | Loan Amount |
|---|---|---|---|
| Open | Shafiuddin Mohammed | $436,500 | |
| Previous Owner | Sheikhali Dahie | $235,000 |
Source: Public Records
Tax History Compared to Growth
Tax History
| Year | Tax Paid | Tax Assessment Tax Assessment Total Assessment is a certain percentage of the fair market value that is determined by local assessors to be the total taxable value of land and additions on the property. | Land | Improvement |
|---|---|---|---|---|
| 2025 | $7,481 | $664,100 | $102,000 | $562,100 |
| 2024 | $7,481 | $638,700 | $93,500 | $545,200 |
| 2023 | $6,685 | $642,700 | $93,500 | $549,200 |
| 2022 | $6,481 | $635,100 | $76,500 | $558,600 |
| 2021 | $6,174 | $543,900 | $70,000 | $473,900 |
| 2020 | $6,923 | $513,700 | $66,500 | $447,200 |
| 2019 | $5,852 | $491,300 | $56,000 | $435,300 |
| 2018 | $6,218 | $452,900 | $0 | $0 |
| 2017 | $5,355 | $449,000 | $0 | $0 |
| 2016 | $5,428 | $392,100 | $0 | $0 |
| 2015 | $5,547 | $392,100 | $66,700 | $325,400 |
| 2014 | -- | $354,300 | $71,000 | $283,300 |
Source: Public Records
Map
Nearby Homes
- 1635 117th Ave NE
- 11505 Palisade Ct NE
- 11358 Chisholm Cir NE Unit E
- 1824 111th Ave NE
- 1842 111th Ave NE
- 11221 Aberdeen St NE Unit I
- 11125 Baltimore St NE Unit L
- 10911 Goodhue St NE Unit D
- 2070 120th Ave NE
- 2255 119th Cir NE
- 11995 Aberdeen St NE Unit 11995
- 11365 Pierce St NE
- 2464 Tournament Players Cir N
- 11429 Pierce St NE
- 12024 Owatonna Ct NE
- 11030 Amen Cir NE
- 2356 119th Cir NE
- 2348 119th Cir NE
- 1936 121st Ave NE
- 12041 Owatonna Ct NE
- 11445 Arnold Palmer Dr
- 11417 Arnold Palmer Dr
- 11455 Arnold Palmer Dr
- 11432 Arnold Palmer Dr
- 11440 Arnold Palmer Dr
- 11424 Arnold Palmer Dr
- 11399 Arnold Palmer Dr
- 11448 Arnold Palmer Dr
- 11408 Arnold Palmer Dr
- 11458 Arnold Palmer Dr
- 11400 Arnold Palmer Dr
- 11469 Arnold Palmer Dr
- 11387 Arnold Palmer Dr
- 11468 Arnold Palmer Dr
- 11392 Arnold Palmer Dr
- 11478 Arnold Palmer Dr
- 11479 Arnold Palmer Dr
- 11384 Arnold Palmer Dr
- 11395 Hastings St NE
- 11375 Arnold Palmer Dr