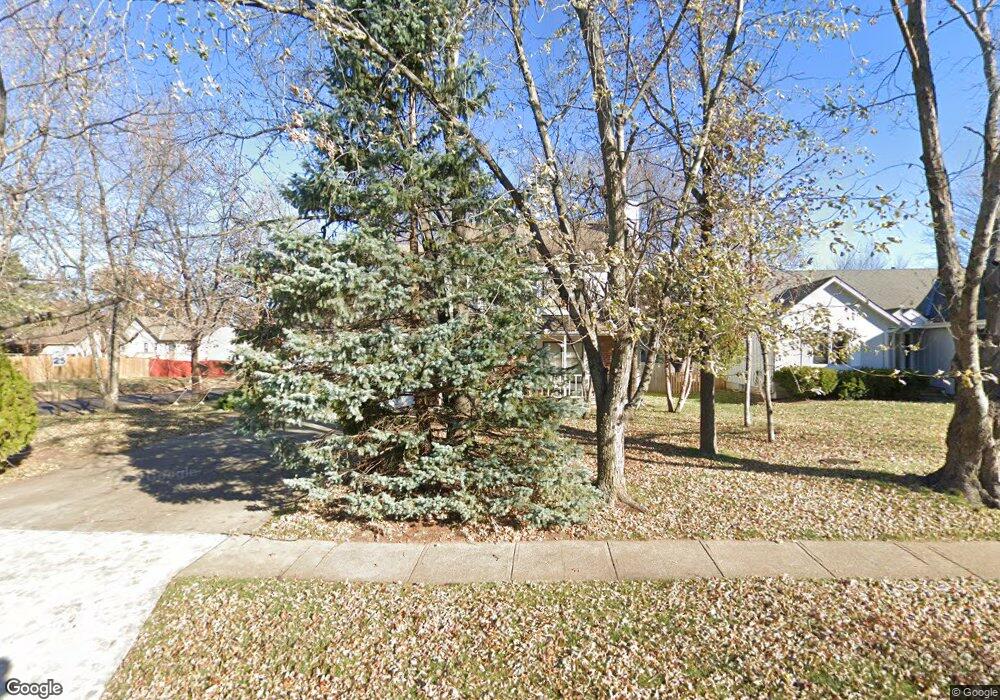
11431 Grant St Overland Park, KS 66210
Central Overland Park NeighborhoodEstimated Value: $486,000 - $521,700
4
Beds
3
Baths
2,740
Sq Ft
$187/Sq Ft
Est. Value
About This Home
This home is located at 11431 Grant St, Overland Park, KS 66210 and is currently estimated at $511,675, approximately $186 per square foot. 11431 Grant St is a home located in Johnson County with nearby schools including Indian Valley Elementary School, Oxford Middle, and Blue Valley Northwest High School.
Ownership History
Date
Name
Owned For
Owner Type
Purchase Details
Closed on
May 29, 2020
Sold by
Carr Thomas Joseph and Carr Charlotte
Bought by
Malick John P and Malick Jessica L
Current Estimated Value
Home Financials for this Owner
Home Financials are based on the most recent Mortgage that was taken out on this home.
Original Mortgage
$346,750
Outstanding Balance
$307,940
Interest Rate
3.3%
Mortgage Type
New Conventional
Estimated Equity
$203,735
Purchase Details
Closed on
Jun 23, 2011
Sold by
Carr Amy Marie
Bought by
Carr Thomas Joseph
Purchase Details
Closed on
Jul 11, 2003
Sold by
Carr Thomas J and Carr Amy M
Bought by
Carr Thomas J and Carr Amy M
Home Financials for this Owner
Home Financials are based on the most recent Mortgage that was taken out on this home.
Original Mortgage
$105,000
Interest Rate
4.68%
Mortgage Type
Purchase Money Mortgage
Purchase Details
Closed on
Jul 2, 2003
Sold by
Sebesta Don E and Sebesta Patricia A
Bought by
Carr Thomas J
Home Financials for this Owner
Home Financials are based on the most recent Mortgage that was taken out on this home.
Original Mortgage
$105,000
Interest Rate
4.68%
Mortgage Type
Purchase Money Mortgage
Create a Home Valuation Report for This Property
The Home Valuation Report is an in-depth analysis detailing your home's value as well as a comparison with similar homes in the area
Home Values in the Area
Average Home Value in this Area
Purchase History
| Date | Buyer | Sale Price | Title Company |
|---|---|---|---|
| Malick John P | -- | First United Title Llc | |
| Carr Thomas Joseph | -- | None Available | |
| Carr Thomas J | -- | Security Land Title Company | |
| Carr Thomas J | -- | Security Land Title Company |
Source: Public Records
Mortgage History
| Date | Status | Borrower | Loan Amount |
|---|---|---|---|
| Open | Malick John P | $346,750 | |
| Previous Owner | Carr Thomas J | $105,000 | |
| Closed | Carr Thomas J | $106,500 |
Source: Public Records
Tax History Compared to Growth
Tax History
| Year | Tax Paid | Tax Assessment Tax Assessment Total Assessment is a certain percentage of the fair market value that is determined by local assessors to be the total taxable value of land and additions on the property. | Land | Improvement |
|---|---|---|---|---|
| 2024 | $5,422 | $53,026 | $11,264 | $41,762 |
| 2023 | $5,010 | $48,162 | $11,264 | $36,898 |
| 2022 | $4,815 | $45,459 | $11,264 | $34,195 |
| 2021 | $4,815 | $42,780 | $9,789 | $32,991 |
| 2020 | $3,992 | $35,512 | $8,511 | $27,001 |
| 2019 | $4,032 | $35,110 | $5,678 | $29,432 |
| 2018 | $3,406 | $32,200 | $5,678 | $26,522 |
| 2017 | $3,549 | $29,774 | $5,678 | $24,096 |
| 2016 | $3,201 | $26,841 | $5,678 | $21,163 |
| 2015 | $3,041 | $25,415 | $5,678 | $19,737 |
| 2013 | -- | $26,611 | $5,678 | $20,933 |
Source: Public Records
Map
Nearby Homes
- 11404 Grandview Dr
- 9013 W 115th St
- 11163 Eby St
- 8712 W 113th St
- 8500 W 113th St
- 11316 Hemlock St
- 8635 W 109th St
- 8607 W 108 Place
- 11447 Craig St
- 8028 W 116th St
- 9417 W 120th St
- 8819 W 106th Terrace
- 11838 Mackey St
- 8858 W 106th Terrace
- 11920 Grandview St
- 11721 Craig St
- 11928 Grant St
- 11504 Newton St
- 12103 Slater St
- 12044 Mackey St
- 11431 Grant Dr
- 11427 Grant St
- 11435 Grant St
- 11435 Grant Dr
- 9123 W 113th St
- 11423 Grant St
- 11441 Grant St
- 9205 W 113th St
- 9119 W 113th St
- 9209 W 113th St
- 11430 Grant St
- 11426 Grant St
- 11419 Grant St
- 9131 W 113th St
- 11445 Grant St
- 11434 Grant Dr
- 11434 Grant St
- 11422 Grant St
- 9217 W 113th St
- 11438 Grant Dr