Estimated Value: $1,283,000 - $1,540,000
8
Beds
7
Baths
6,359
Sq Ft
$223/Sq Ft
Est. Value
About This Home
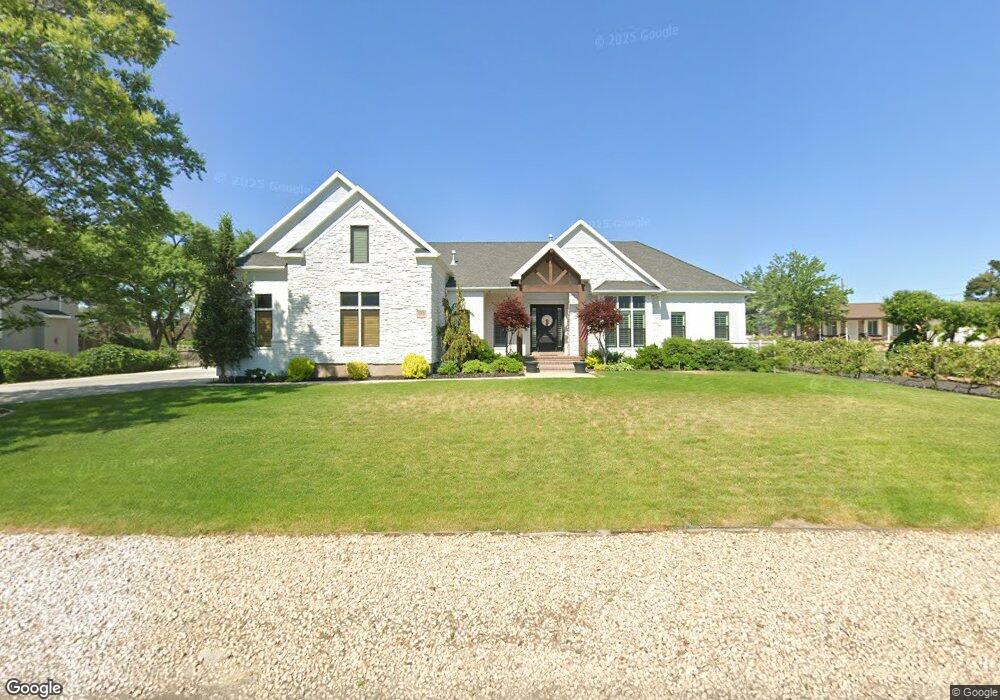
This home is located at 11432 S Hagan Rd, Sandy, UT 84092 and is currently estimated at $1,418,669, approximately $223 per square foot. 11432 S Hagan Rd is a home located in Salt Lake County with nearby schools including Sunrise Elementary School, Bell Canyon Montessori School, and Challenger School - Sandy.
Ownership History
Date
Name
Owned For
Owner Type
Purchase Details
Closed on
Sep 20, 2022
Sold by
Tyler Yearsley
Bought by
Tyler And Carlie Yearsley Living Trust
Current Estimated Value
Purchase Details
Closed on
Aug 6, 2019
Sold by
Kempin Darlene Momilani
Bought by
Yearsley Tyler and Yearsley Carlie
Home Financials for this Owner
Home Financials are based on the most recent Mortgage that was taken out on this home.
Original Mortgage
$660,000
Interest Rate
3.73%
Mortgage Type
New Conventional
Purchase Details
Closed on
Dec 9, 2016
Sold by
Kempin Darlene Momilani
Bought by
Kempin Darlene Momilani and The Darlene Kempin Living Trust
Purchase Details
Closed on
Dec 22, 2015
Sold by
Kempin Kevin Michael
Bought by
Kempin Darlene Momilani
Purchase Details
Closed on
Jul 5, 2012
Sold by
Kohler Bryan R
Bought by
Kempin Kevin M and Kempin Darlene
Home Financials for this Owner
Home Financials are based on the most recent Mortgage that was taken out on this home.
Original Mortgage
$365,000
Interest Rate
3%
Mortgage Type
Adjustable Rate Mortgage/ARM
Purchase Details
Closed on
Oct 28, 2008
Sold by
Dipo Scott Wayne and Dipo Deanna Kay
Bought by
Kohler Bryan R
Home Financials for this Owner
Home Financials are based on the most recent Mortgage that was taken out on this home.
Original Mortgage
$507,500
Interest Rate
6.07%
Mortgage Type
FHA
Purchase Details
Closed on
Jul 26, 2005
Sold by
Dipo Scott W and Dipo Deanna K
Bought by
Dipo Scott Wayne and Dipo Deanna Kay
Home Financials for this Owner
Home Financials are based on the most recent Mortgage that was taken out on this home.
Original Mortgage
$572,000
Interest Rate
4.75%
Mortgage Type
New Conventional
Purchase Details
Closed on
Jul 14, 2005
Sold by
Dipo Deanna K and Dipo Scott W
Bought by
Dipo Scott W and Dipo Deanna K
Home Financials for this Owner
Home Financials are based on the most recent Mortgage that was taken out on this home.
Original Mortgage
$572,000
Interest Rate
4.75%
Mortgage Type
New Conventional
Purchase Details
Closed on
Jun 14, 2005
Sold by
Dipo Construction Co
Bought by
Dipo Deanna K and Dipo Scott W
Home Financials for this Owner
Home Financials are based on the most recent Mortgage that was taken out on this home.
Original Mortgage
$572,000
Interest Rate
4.75%
Mortgage Type
New Conventional
Create a Home Valuation Report for This Property
The Home Valuation Report is an in-depth analysis detailing your home's value as well as a comparison with similar homes in the area
Home Values in the Area
Average Home Value in this Area
Purchase History
| Date | Buyer | Sale Price | Title Company |
|---|---|---|---|
| Tyler And Carlie Yearsley Living Trust | -- | -- | |
| Yearsley Tyler | -- | Provo Land Title Company | |
| Kempin Darlene Momilani | -- | Accommodation | |
| Kempin Darlene Momilani | -- | None Available | |
| Kempin Kevin M | -- | First American Title Co Llc | |
| Kohler Bryan R | -- | Title West | |
| Dipo Scott Wayne | -- | -- | |
| Dipo Scott W | -- | First American Title | |
| Dipo Deanna K | -- | First American Title |
Source: Public Records
Mortgage History
| Date | Status | Borrower | Loan Amount |
|---|---|---|---|
| Previous Owner | Yearsley Tyler | $660,000 | |
| Previous Owner | Kempin Kevin M | $365,000 | |
| Previous Owner | Kohler Bryan R | $507,500 | |
| Previous Owner | Dipo Scott W | $572,000 |
Source: Public Records
Tax History
| Year | Tax Paid | Tax Assessment Tax Assessment Total Assessment is a certain percentage of the fair market value that is determined by local assessors to be the total taxable value of land and additions on the property. | Land | Improvement |
|---|---|---|---|---|
| 2025 | $7,187 | $1,433,800 | $326,700 | $1,107,100 |
| 2024 | $7,187 | $1,359,000 | $314,400 | $1,044,600 |
| 2023 | $6,436 | $1,215,900 | $302,300 | $913,600 |
| 2022 | $6,508 | $1,202,000 | $282,600 | $919,400 |
| 2021 | $5,767 | $907,100 | $224,900 | $682,200 |
| 2020 | $5,792 | $860,200 | $224,900 | $635,300 |
| 2019 | $6,606 | $957,600 | $235,500 | $722,100 |
| 2016 | $5,378 | $755,000 | $212,200 | $542,800 |
Source: Public Records
Map
Nearby Homes
- 11341 S Silver Buckle Way
- 1320 E Woodhill Cir
- 1234 E Sandy Ridge Dr
- 1653 Crescent View Dr
- 11755 S Canberra Dr
- 1129 E Sanders Rd
- 11382 S Canyon Falls Ln
- 11037 E Robinson Curcle
- 11318 Canyon Falls Ln
- 1074 E Black Forest Dr
- 11855 S Hidden Valley Dr
- 1123 E 11780 S
- 11865 Maple Ridge Rd
- 10868 Prescott Dr
- 11202 S 1000 E
- 11940 S Pineridge Rd
- 10889 Granite Dr
- 966 E Granite Peak Dr
- 10941 S Mill Canyon Dr
- 1139 Hidden Valley Dr
- 11432 Hagan Rd
- 11450 Hagan Rd
- 1402 E 11400 S
- 11435 Hagan Rd
- 11464 Hagan Rd
- 11447 S 1380 E
- 11415 S Hagan Rd Unit 2
- 11415 S Hagan Rd
- 11419 S 1380 E
- 11415 S Hagan Rd
- 11415 Hagan Rd
- 11486 Hagan Rd
- 11495 S 1380 E
- 11465 S Hagan Rd
- 11465 Hagan Rd
- 1502 E 11400 S
- 1446 Knollwood Dr
- 11383 S Millwood Dr
- 11383 Millwood Dr
- 1458 E Knollwood Dr
Your Personal Tour Guide
Ask me questions while you tour the home.