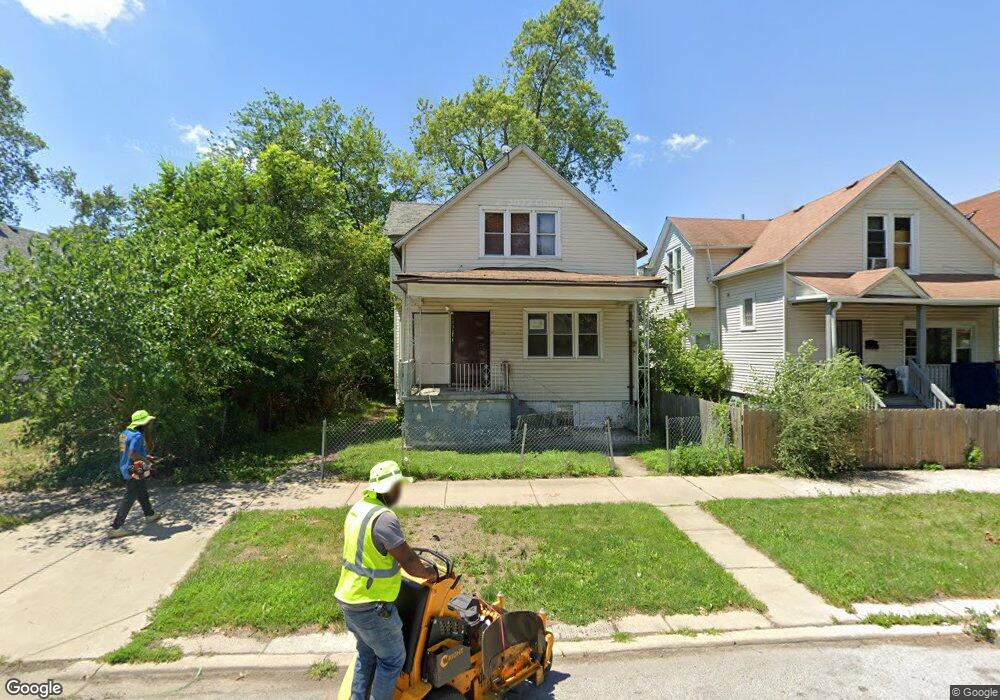
11436 S Yale Ave Chicago, IL 60628
Roseland NeighborhoodEstimated Value: $185,784
2
Beds
2
Baths
906
Sq Ft
$205/Sq Ft
Est. Value
About This Home
This home is located at 11436 S Yale Ave, Chicago, IL 60628 and is currently estimated at $185,784, approximately $205 per square foot. 11436 S Yale Ave is a home located in Cook County with nearby schools including Alex Haley Elementary Academy, Fenger Academy High School, and CICS Prairie.
Ownership History
Date
Name
Owned For
Owner Type
Purchase Details
Closed on
Jul 23, 2019
Sold by
County Of Cook
Bought by
County Of Cook and Cook County Land Bank Authority
Current Estimated Value
Purchase Details
Closed on
Oct 26, 2004
Sold by
Khan Nadeem
Bought by
Bennett Eric
Home Financials for this Owner
Home Financials are based on the most recent Mortgage that was taken out on this home.
Original Mortgage
$113,500
Outstanding Balance
$66,871
Interest Rate
8.6%
Mortgage Type
Unknown
Estimated Equity
$118,913
Purchase Details
Closed on
Feb 27, 2004
Sold by
Citifinancial Mortgage Co Inc
Bought by
Khan Nadeem
Purchase Details
Closed on
Aug 14, 2002
Sold by
Jones Barbara
Bought by
Citifinancial Mtg Company and Associates Home Equity Services Inc
Purchase Details
Closed on
May 1, 2001
Sold by
Sayles Emil
Bought by
Jones Barbara
Purchase Details
Closed on
Mar 1, 2000
Sold by
Bakeman C Vincent
Bought by
Sayles Emil
Create a Home Valuation Report for This Property
The Home Valuation Report is an in-depth analysis detailing your home's value as well as a comparison with similar homes in the area
Home Values in the Area
Average Home Value in this Area
Purchase History
| Date | Buyer | Sale Price | Title Company |
|---|---|---|---|
| County Of Cook | -- | Attorney | |
| Bennett Eric | $130,000 | 1St American Title | |
| Khan Nadeem | $37,000 | 1St American Title | |
| Citifinancial Mtg Company | -- | -- | |
| Jones Barbara | $73,000 | -- | |
| Sayles Emil | $15,000 | -- |
Source: Public Records
Mortgage History
| Date | Status | Borrower | Loan Amount |
|---|---|---|---|
| Open | Bennett Eric | $113,500 | |
| Closed | Bennett Eric | $10,000 |
Source: Public Records
Tax History Compared to Growth
Tax History
| Year | Tax Paid | Tax Assessment Tax Assessment Total Assessment is a certain percentage of the fair market value that is determined by local assessors to be the total taxable value of land and additions on the property. | Land | Improvement |
|---|---|---|---|---|
| 2024 | $522 | -- | -- | -- |
| 2023 | $522 | -- | -- | -- |
| 2022 | $522 | -- | -- | -- |
| 2021 | $522 | $2,499 | $1,291 | $1,208 |
| 2020 | $522 | $5,440 | $2,536 | $2,904 |
| 2019 | $513 | $5,978 | $2,536 | $3,442 |
| 2018 | $503 | $5,978 | $2,536 | $3,442 |
| 2017 | $1,158 | $8,743 | $2,306 | $6,437 |
| 2016 | $1,254 | $8,743 | $2,306 | $6,437 |
| 2015 | $1,124 | $8,743 | $2,306 | $6,437 |
| 2014 | $1,033 | $8,120 | $2,075 | $6,045 |
| 2013 | $1,001 | $8,120 | $2,075 | $6,045 |
Source: Public Records
Map
Nearby Homes
- 11516 S Yale Ave
- 11521 S Yale Ave
- 125 W 114th St
- 128 W 115th St
- 120 W 115th St
- 11353 S Stewart Ave
- 106 W 114th St
- 11532 S Harvard Ave
- 11531 S Stewart Ave
- 11527 S La Salle St
- 11559 S Wentworth Ave
- 11612 S Yale Ave
- 352 W 116th St
- 406 W 116th St Unit 412
- 11317 S Eggleston Ave
- 11531 S Perry Ave
- 226 W 112th Place
- 412 W 116th St
- 11577 S La Salle St
- 11413 S Normal Ave
- 11430 S Yale Ave
- 11428 S Yale Ave
- 11442 S Yale Ave
- 11426 S Yale Ave
- 11422 S Yale Ave
- 11437 S Princeton Ave
- 11439 S Princeton Ave
- 11420 S Yale Ave
- 11429 S Princeton Ave
- 11441 S Princeton Ave
- 11418 S Yale Ave
- 238 W 115th St
- 242 W 115th St
- 11443 S Yale Ave
- 11443 S Yale Ave
- 246 W 115th St
- 11435 S Yale Ave
- 11437 S Yale Ave
- 11431 S Yale Ave
- 11441 S Yale Ave