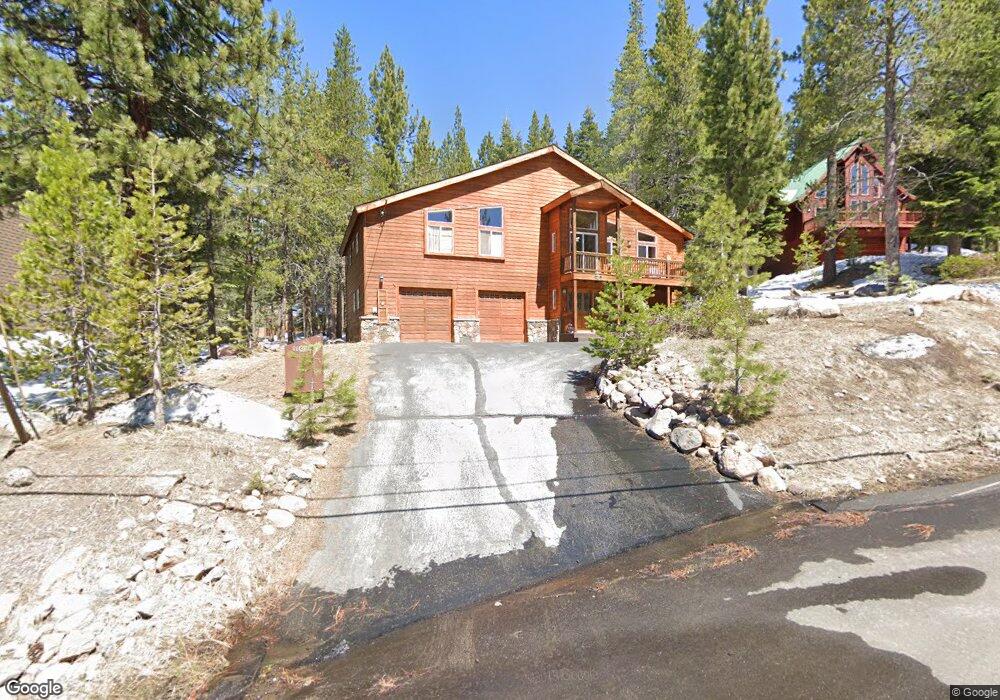
11438 Chamonix Rd Truckee, CA 96161
Tahoe Donner NeighborhoodEstimated Value: $1,429,000 - $1,679,000
4
Beds
3
Baths
3,145
Sq Ft
$499/Sq Ft
Est. Value
About This Home
This home is located at 11438 Chamonix Rd, Truckee, CA 96161 and is currently estimated at $1,569,793, approximately $499 per square foot. 11438 Chamonix Rd is a home located in Nevada County with nearby schools including Truckee Elementary School, Alder Creek Middle School, and Tahoe Truckee High School.
Ownership History
Date
Name
Owned For
Owner Type
Purchase Details
Closed on
May 28, 2008
Sold by
Kar Ronik W and Kar Laurie A
Bought by
Kar Ronik W and Kar Laurie A
Current Estimated Value
Purchase Details
Closed on
Mar 13, 2002
Sold by
Bender Rebecca S and Edwards Scott
Bought by
Kar Ronik and Kar Laurie
Home Financials for this Owner
Home Financials are based on the most recent Mortgage that was taken out on this home.
Original Mortgage
$351,750
Outstanding Balance
$142,379
Interest Rate
6.62%
Estimated Equity
$1,427,414
Purchase Details
Closed on
Dec 8, 2000
Sold by
Edwards Scott
Bought by
Bender Rebecca S
Purchase Details
Closed on
Aug 23, 2000
Sold by
Soo Mah Lim S and Soo Ken K H
Bought by
Edwards Scott and Bender Rebecca S
Create a Home Valuation Report for This Property
The Home Valuation Report is an in-depth analysis detailing your home's value as well as a comparison with similar homes in the area
Home Values in the Area
Average Home Value in this Area
Purchase History
| Date | Buyer | Sale Price | Title Company |
|---|---|---|---|
| Kar Ronik W | -- | None Available | |
| Kar Ronik W | -- | None Available | |
| Kar Ronik | $469,000 | Placer Title Company | |
| Bender Rebecca S | -- | First American Title Ins Co | |
| Edwards Scott | $81,000 | First American Title Ins Co |
Source: Public Records
Mortgage History
| Date | Status | Borrower | Loan Amount |
|---|---|---|---|
| Open | Kar Ronik | $351,750 |
Source: Public Records
Tax History Compared to Growth
Tax History
| Year | Tax Paid | Tax Assessment Tax Assessment Total Assessment is a certain percentage of the fair market value that is determined by local assessors to be the total taxable value of land and additions on the property. | Land | Improvement |
|---|---|---|---|---|
| 2025 | $10,574 | $855,449 | $172,885 | $682,564 |
| 2024 | $10,483 | $838,677 | $169,496 | $669,181 |
| 2023 | $10,483 | $822,233 | $166,173 | $656,060 |
| 2022 | $10,211 | $806,112 | $162,915 | $643,197 |
| 2021 | $9,772 | $790,248 | $159,662 | $630,586 |
| 2020 | $9,711 | $782,146 | $158,025 | $624,121 |
| 2019 | $9,725 | $766,811 | $154,927 | $611,884 |
| 2018 | $9,071 | $751,777 | $151,890 | $599,887 |
| 2017 | $8,884 | $737,042 | $148,916 | $588,126 |
| 2016 | $8,814 | $721,822 | $145,227 | $576,595 |
| 2015 | $8,613 | $710,983 | $143,048 | $567,935 |
| 2014 | -- | $697,059 | $140,248 | $556,811 |
Source: Public Records
Map
Nearby Homes
- 11665 Zermatt Dr
- 11511 Baden Rd
- 16465 Northwoods Blvd
- 13081 Davos Dr
- 11781 Chamonix Rd
- 17249 Northwoods Blvd
- 12800 Zurich Place
- 10985 Bolzano Dr
- 12834 Zurich Place Unit 2
- 11004 Innsbruck Ave
- 10986 Innsbruck Ave
- 12815 Zurich Place
- 17246 Northwoods Blvd
- 17308 Northwoods Blvd
- 12710 Zurich Place
- 12755 Zurich Place
- 12686 Zurich Place Unit 2
- 12471 Northwoods Blvd Unit 1
- 11030 Ski Slope Way
- 13892 Davos Dr
- 11388 Chamonix Rd
- 11414 Chamonix Rd
- 11464 Chamonix Rd
- 11973 Northwoods Blvd
- 12079 Northwoods Blvd
- 11957 Northwoods Blvd
- 12091 Northwoods Blvd
- 11502 Chamonix Rd
- 11941 Northwoods Blvd
- 11387 Chamonix Rd
- 12103 Northwoods Blvd Unit 2
- 11522 Chamonix Rd
- 11401 Chamonix Rd
- 12115 Northwoods Blvd
- 12127 Northwoods Blvd
- 11515 Chamonix Rd
- 11562 Chamonix Rd
- 11521 Chamonix Rd
- 12139 Northwoods Blvd
- 11576 Chamonix Rd