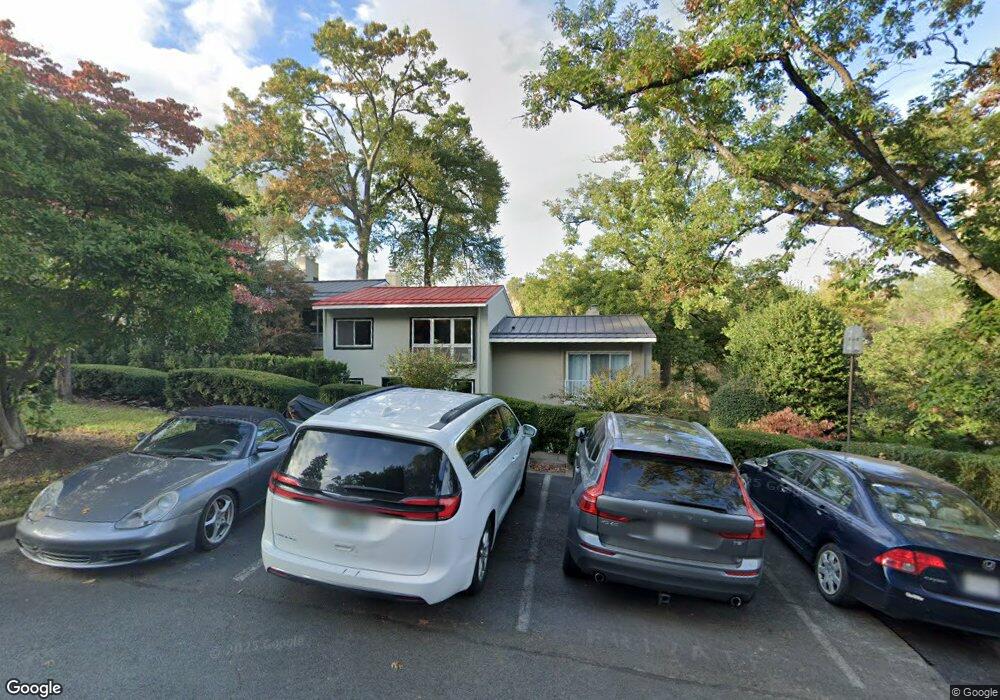
11446 Waterview Cluster Reston, VA 20190
Lake Anne NeighborhoodEstimated Value: $901,000 - $1,051,991
3
Beds
4
Baths
1,750
Sq Ft
$562/Sq Ft
Est. Value
About This Home
This home is located at 11446 Waterview Cluster, Reston, VA 20190 and is currently estimated at $983,248, approximately $561 per square foot. 11446 Waterview Cluster is a home located in Fairfax County with nearby schools including Lake Anne Elementary, Langston Hughes Middle School, and South Lakes High School.
Ownership History
Date
Name
Owned For
Owner Type
Purchase Details
Closed on
Apr 10, 2025
Sold by
Marvin Brooke C
Bought by
Marvin Brooke C and Nijs Sonja
Current Estimated Value
Purchase Details
Closed on
Oct 16, 2014
Sold by
Gormally Tr John M
Bought by
Marvin Brooke C
Home Financials for this Owner
Home Financials are based on the most recent Mortgage that was taken out on this home.
Original Mortgage
$410,000
Interest Rate
4.09%
Mortgage Type
New Conventional
Purchase Details
Closed on
Jan 26, 1994
Sold by
Keys R A
Bought by
Gormally John
Home Financials for this Owner
Home Financials are based on the most recent Mortgage that was taken out on this home.
Original Mortgage
$196,000
Interest Rate
7.11%
Create a Home Valuation Report for This Property
The Home Valuation Report is an in-depth analysis detailing your home's value as well as a comparison with similar homes in the area
Home Values in the Area
Average Home Value in this Area
Purchase History
| Date | Buyer | Sale Price | Title Company |
|---|---|---|---|
| Marvin Brooke C | -- | None Listed On Document | |
| Marvin Brooke C | -- | None Listed On Document | |
| Marvin Brooke C | $585,000 | -- | |
| Gormally John | $245,000 | -- |
Source: Public Records
Mortgage History
| Date | Status | Borrower | Loan Amount |
|---|---|---|---|
| Previous Owner | Marvin Brooke C | $410,000 | |
| Previous Owner | Gormally John | $196,000 |
Source: Public Records
Tax History Compared to Growth
Tax History
| Year | Tax Paid | Tax Assessment Tax Assessment Total Assessment is a certain percentage of the fair market value that is determined by local assessors to be the total taxable value of land and additions on the property. | Land | Improvement |
|---|---|---|---|---|
| 2025 | $11,235 | $1,033,140 | $318,000 | $715,140 |
| 2024 | $11,235 | $931,970 | $318,000 | $613,970 |
| 2023 | $10,003 | $850,990 | $316,000 | $534,990 |
| 2022 | $9,053 | $760,440 | $287,000 | $473,440 |
| 2021 | $8,891 | $728,440 | $255,000 | $473,440 |
| 2020 | $8,160 | $663,140 | $255,000 | $408,140 |
| 2019 | $7,859 | $638,700 | $250,000 | $388,700 |
| 2018 | $6,931 | $602,700 | $236,000 | $366,700 |
| 2017 | $7,281 | $602,700 | $236,000 | $366,700 |
| 2016 | $7,133 | $591,700 | $225,000 | $366,700 |
| 2015 | $6,881 | $591,700 | $225,000 | $366,700 |
| 2014 | -- | $590,270 | $225,000 | $365,270 |
Source: Public Records
Map
Nearby Homes
- 11400 Washington Plaza W Unit 103
- 1674 Chimney House Rd
- 1609 Fellowship Square
- 1620 Fellowship Square
- 1624 Fellowship Square
- 11603 Vantage Hill Rd Unit 22C
- 11611 Vantage Hill Rd Unit 1A
- 11619 Vantage Hill Rd Unit 1A
- 1532 Northgate Square Unit 12A
- 1640 Wainwright Dr
- 1552 Northgate Square Unit 12B
- 11221 S Shore Rd
- 1413 Northgate Square Unit 13/12B
- 11598 Newport Cove Ln
- 1422 Northgate Square Unit 22/1A
- 1434 Northgate Square Unit 34/21B
- 11152 Forest Edge Dr
- 1723 Ascot Way Unit A
- 1704 Bandit Loop Unit 20A
- 1432 Greenmont Ct
- 11446 Waterhaven Ct
- 11448 Waterview Cluster
- 11448 Waterhaven Ct
- 11444 Waterview Cluster
- 11444 Waterview Cluster
- 11444 Waterhaven Ct
- 11450 Waterhaven Ct
- 11450 Waterview Cluster
- 11450 Waterview Cluster
- 11442 Waterhaven Ct
- 11446 Waterview Cluster
- 11442 Waterview Cluster
- 11440 Waterhaven Ct
- 11440 Waterview Cluster
- 11440 Waterview Cluster
- 11438 Waterhaven Ct
- 11438 Waterview Cluster
- 11438 Waterview Cluster
- 11436 Waterview Cluster
- 11436 Waterhaven Ct