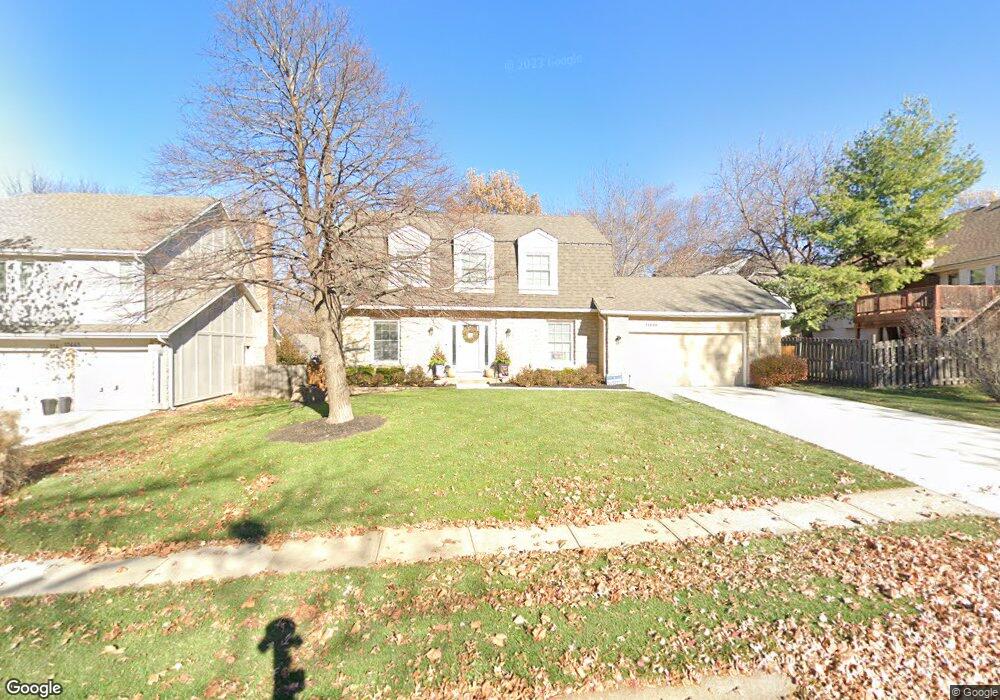
11449 Grant St Overland Park, KS 66210
Central Overland Park NeighborhoodEstimated Value: $430,000 - $459,000
4
Beds
3
Baths
2,178
Sq Ft
$205/Sq Ft
Est. Value
About This Home
This home is located at 11449 Grant St, Overland Park, KS 66210 and is currently estimated at $445,806, approximately $204 per square foot. 11449 Grant St is a home located in Johnson County with nearby schools including Indian Valley Elementary School, Oxford Middle, and Blue Valley Northwest High School.
Ownership History
Date
Name
Owned For
Owner Type
Purchase Details
Closed on
Aug 7, 2019
Sold by
Clark Guy C and Clark Megan E
Bought by
Clark Guy C and Clark Megan E
Current Estimated Value
Purchase Details
Closed on
Jul 15, 2004
Sold by
Vitali Terrence R and Vitali Bridget J
Bought by
Clark Guy and Clark Megan
Home Financials for this Owner
Home Financials are based on the most recent Mortgage that was taken out on this home.
Original Mortgage
$222,000
Outstanding Balance
$127,284
Interest Rate
8.55%
Mortgage Type
Purchase Money Mortgage
Estimated Equity
$318,522
Create a Home Valuation Report for This Property
The Home Valuation Report is an in-depth analysis detailing your home's value as well as a comparison with similar homes in the area
Home Values in the Area
Average Home Value in this Area
Purchase History
| Date | Buyer | Sale Price | Title Company |
|---|---|---|---|
| Clark Guy C | -- | None Available | |
| Clark Guy | -- | Capital Title Agency Inc |
Source: Public Records
Mortgage History
| Date | Status | Borrower | Loan Amount |
|---|---|---|---|
| Open | Clark Guy | $222,000 |
Source: Public Records
Tax History Compared to Growth
Tax History
| Year | Tax Paid | Tax Assessment Tax Assessment Total Assessment is a certain percentage of the fair market value that is determined by local assessors to be the total taxable value of land and additions on the property. | Land | Improvement |
|---|---|---|---|---|
| 2024 | $4,362 | $42,906 | $11,255 | $31,651 |
| 2023 | $4,404 | $42,400 | $11,255 | $31,145 |
| 2022 | $3,966 | $37,536 | $11,255 | $26,281 |
| 2021 | $3,968 | $35,535 | $9,781 | $25,754 |
| 2020 | $3,858 | $34,327 | $8,504 | $25,823 |
| 2019 | $3,797 | $33,074 | $5,673 | $27,401 |
| 2018 | $3,729 | $31,832 | $5,673 | $26,159 |
| 2017 | $3,443 | $28,888 | $5,673 | $23,215 |
| 2016 | $3,155 | $26,462 | $5,673 | $20,789 |
| 2015 | $3,169 | $26,485 | $5,673 | $20,812 |
| 2013 | -- | $23,759 | $5,673 | $18,086 |
Source: Public Records
Map
Nearby Homes
- 11404 Grandview Dr
- 9013 W 115th St
- 8712 W 113th St
- 11163 Eby St
- 8500 W 113th St
- 11316 Hemlock St
- 8635 W 109th St
- 8607 W 108 Place
- 11447 Craig St
- 8028 W 116th St
- 9417 W 120th St
- 11838 Mackey St
- 8819 W 106th Terrace
- 11920 Grandview St
- 8858 W 106th Terrace
- 11721 Craig St
- 11504 Newton St
- 11928 Grant St
- 12031 Hemlock St
- 12103 Slater St
- 11445 Grant St
- 11404 Grandview St
- 11400 Grandview St
- 11441 Grant St
- 11340 Grandview Dr
- 11340 Grandview St
- 9115 W 113th St
- 9119 W 113th St
- 11442 Grant St
- 11446 Grant St
- 11435 Grant Dr
- 11435 Grant St
- 11438 Grant Dr
- 11336 Grandview St
- 11438 Grant St
- 11450 Grant St
- 11405 Grandview St
- 9111 W 113th St
- 11401 Grandview St
- 11434 Grant Dr