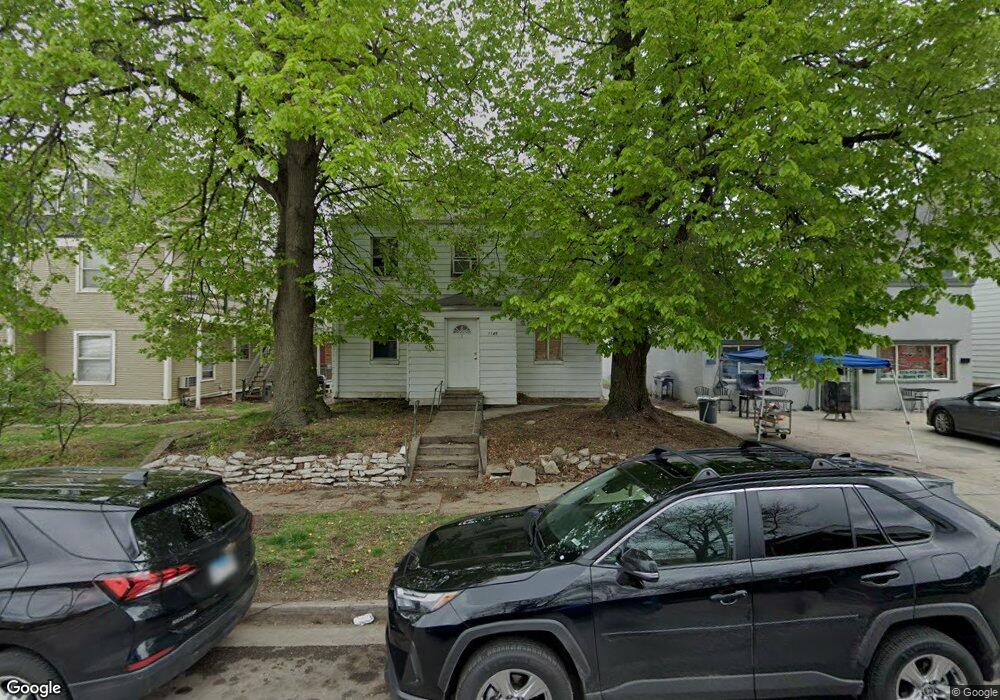
1145 24th St Des Moines, IA 50311
Drake NeighborhoodEstimated Value: $152,285 - $206,000
3
Beds
5
Baths
5,880
Sq Ft
$30/Sq Ft
Est. Value
About This Home
This home is located at 1145 24th St, Des Moines, IA 50311 and is currently estimated at $179,143, approximately $30 per square foot. 1145 24th St is a home located in Polk County with nearby schools including Roosevelt High School.
Ownership History
Date
Name
Owned For
Owner Type
Purchase Details
Closed on
Apr 20, 2007
Sold by
Rottler Steven P
Bought by
Mulvihill Farms Inc
Current Estimated Value
Purchase Details
Closed on
Oct 21, 2002
Sold by
Kruse Ann L and Kruse Brian C
Bought by
Rottler Steven P and Rottler Steven
Home Financials for this Owner
Home Financials are based on the most recent Mortgage that was taken out on this home.
Original Mortgage
$259,680
Interest Rate
6%
Mortgage Type
Land Contract Argmt. Of Sale
Create a Home Valuation Report for This Property
The Home Valuation Report is an in-depth analysis detailing your home's value as well as a comparison with similar homes in the area
Home Values in the Area
Average Home Value in this Area
Purchase History
| Date | Buyer | Sale Price | Title Company |
|---|---|---|---|
| Mulvihill Farms Inc | $79,500 | Itc | |
| Rottler Steven P | $324,600 | -- |
Source: Public Records
Mortgage History
| Date | Status | Borrower | Loan Amount |
|---|---|---|---|
| Previous Owner | Rottler Steven P | $259,680 |
Source: Public Records
Tax History Compared to Growth
Tax History
| Year | Tax Paid | Tax Assessment Tax Assessment Total Assessment is a certain percentage of the fair market value that is determined by local assessors to be the total taxable value of land and additions on the property. | Land | Improvement |
|---|---|---|---|---|
| 2025 | $3,856 | $212,000 | $13,100 | $198,900 |
| 2024 | $3,856 | $196,000 | $11,500 | $184,500 |
| 2023 | $3,748 | $196,000 | $11,500 | $184,500 |
| 2022 | $4,380 | $159,000 | $9,600 | $149,400 |
| 2021 | $3,882 | $159,000 | $9,600 | $149,400 |
| 2020 | $4,360 | $130,000 | $8,800 | $121,200 |
| 2019 | $4,462 | $130,000 | $8,800 | $121,200 |
| 2018 | $4,746 | $126,000 | $8,800 | $117,200 |
| 2017 | $4,468 | $126,000 | $8,800 | $117,200 |
| 2016 | $4,658 | $114,000 | $7,500 | $106,500 |
| 2015 | $4,658 | $114,000 | $7,500 | $106,500 |
| 2014 | $4,516 | $101,000 | $7,500 | $93,500 |
Source: Public Records
Map
Nearby Homes