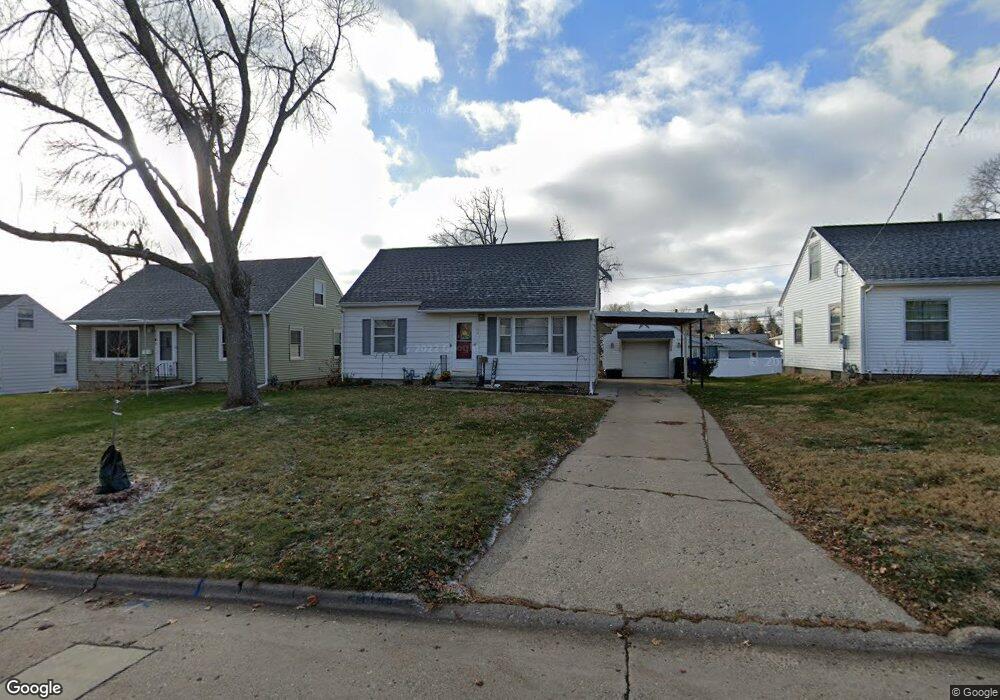
1145 30th St NE Cedar Rapids, IA 52402
Kenwood Park NeighborhoodEstimated Value: $177,000 - $192,000
3
Beds
2
Baths
1,168
Sq Ft
$156/Sq Ft
Est. Value
About This Home
This home is located at 1145 30th St NE, Cedar Rapids, IA 52402 and is currently estimated at $182,351, approximately $156 per square foot. 1145 30th St NE is a home located in Linn County with nearby schools including Franklin Middle School, George Washington High School, and Isaac Newton Christian Academy.
Ownership History
Date
Name
Owned For
Owner Type
Purchase Details
Closed on
Mar 18, 2010
Sold by
Cole Tracy and Cole Tracy L
Bought by
Cosgrove Brian J and Cosgrove Cheanne M
Current Estimated Value
Home Financials for this Owner
Home Financials are based on the most recent Mortgage that was taken out on this home.
Original Mortgage
$122,735
Outstanding Balance
$81,468
Interest Rate
5.01%
Mortgage Type
FHA
Estimated Equity
$100,883
Purchase Details
Closed on
Nov 29, 2007
Sold by
Ryan Jennifer A
Bought by
Villa Tracy
Home Financials for this Owner
Home Financials are based on the most recent Mortgage that was taken out on this home.
Original Mortgage
$92,800
Interest Rate
6.47%
Mortgage Type
Purchase Money Mortgage
Purchase Details
Closed on
May 10, 2003
Sold by
Ideker Jochen M and Ideker Wendi L
Bought by
Ryan Jennifer A
Home Financials for this Owner
Home Financials are based on the most recent Mortgage that was taken out on this home.
Original Mortgage
$85,000
Interest Rate
5.9%
Mortgage Type
Unknown
Create a Home Valuation Report for This Property
The Home Valuation Report is an in-depth analysis detailing your home's value as well as a comparison with similar homes in the area
Home Values in the Area
Average Home Value in this Area
Purchase History
| Date | Buyer | Sale Price | Title Company |
|---|---|---|---|
| Cosgrove Brian J | $124,500 | None Available | |
| Villa Tracy | $115,500 | None Available | |
| Ryan Jennifer A | $106,000 | -- |
Source: Public Records
Mortgage History
| Date | Status | Borrower | Loan Amount |
|---|---|---|---|
| Open | Cosgrove Brian J | $122,735 | |
| Previous Owner | Villa Tracy | $92,800 | |
| Previous Owner | Ryan Jennifer A | $85,000 |
Source: Public Records
Tax History
| Year | Tax Paid | Tax Assessment Tax Assessment Total Assessment is a certain percentage of the fair market value that is determined by local assessors to be the total taxable value of land and additions on the property. | Land | Improvement |
|---|---|---|---|---|
| 2025 | $2,850 | $167,700 | $33,300 | $134,400 |
| 2024 | $2,934 | $161,100 | $30,300 | $130,800 |
| 2023 | $2,934 | $161,100 | $30,300 | $130,800 |
| 2022 | $2,740 | $139,100 | $27,300 | $111,800 |
| 2021 | $2,870 | $132,300 | $25,800 | $106,500 |
| 2020 | $2,870 | $130,100 | $22,700 | $107,400 |
| 2019 | $2,584 | $119,900 | $22,700 | $97,200 |
Source: Public Records
Map
Nearby Homes
- 1214 Center St NE
- 1609 Wildwood Dr NE
- 1517 34th St NE
- 3028 Center Point Rd NE Unit 202
- 734 34th St NE
- 3018 E Ave NE
- 1228 Oakland Rd NE
- 634 33rd St NE
- 521 29th St NE
- 1721 34th St NE
- 1310 K Ave NE
- 410 32nd St NE
- 3723 Kencrest Dr NE
- 3821 Oakland Rd NE
- 300 31st St NE
- 1613 I Ave NE
- 3322 C Ave NE
- 3740 F Ave NE
- 232 31st St NE
- 231 32nd St NE
- 1141 30th St NE
- 1201 30th St NE
- 2952 Prairie Dr NE
- 1133 30th St NE
- 1142 Staub Ct NE
- 1148 Staub Ct NE
- 1130 Staub Ct NE
- 1152 Staub Ct NE
- 1127 30th St NE
- 1144 30th St NE
- 1200 30th St NE
- 1126 Staub Ct NE
- 1136 30th St NE
- 1121 30th St NE
- 2929 Prairie Dr NE
- 1208 30th St NE
- 1132 30th St NE
- 1130 30th St NE
- 1120 Staub Ct NE
- 1202 Staub Ct NE
Your Personal Tour Guide
Ask me questions while you tour the home.