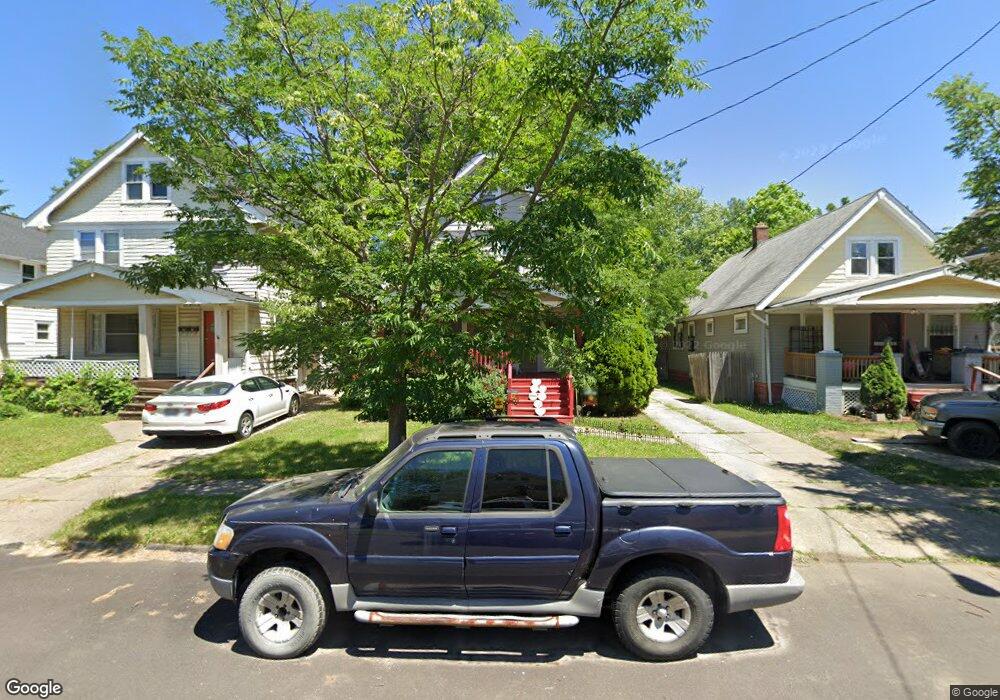
1145 E 172nd St Cleveland, OH 44119
North Collinwood NeighborhoodEstimated Value: $96,000 - $155,000
2
Beds
1
Bath
960
Sq Ft
$119/Sq Ft
Est. Value
About This Home
This home is located at 1145 E 172nd St, Cleveland, OH 44119 and is currently estimated at $114,354, approximately $119 per square foot. 1145 E 172nd St is a home located in Cuyahoga County with nearby schools including Bolton, Andrew J. Rickoff School, and Adlai Stevenson School.
Ownership History
Date
Name
Owned For
Owner Type
Purchase Details
Closed on
Mar 11, 2004
Sold by
Cresthaven Development Inc
Bought by
Carter Gwendolyn R and Carter Gwendolyn
Current Estimated Value
Home Financials for this Owner
Home Financials are based on the most recent Mortgage that was taken out on this home.
Original Mortgage
$90,000
Outstanding Balance
$42,650
Interest Rate
5.87%
Mortgage Type
Stand Alone First
Estimated Equity
$71,704
Purchase Details
Closed on
Jan 30, 2004
Sold by
Patfield Cindy A
Bought by
Cresthaven Development
Home Financials for this Owner
Home Financials are based on the most recent Mortgage that was taken out on this home.
Original Mortgage
$90,000
Outstanding Balance
$42,650
Interest Rate
5.87%
Mortgage Type
Stand Alone First
Estimated Equity
$71,704
Purchase Details
Closed on
Dec 22, 1989
Sold by
Cuthill John
Bought by
Patfield Cindy A
Purchase Details
Closed on
Jan 22, 1987
Sold by
Cuthill Esther A
Bought by
Cuthill John
Purchase Details
Closed on
Jan 1, 1975
Bought by
Cuthill Esther A
Create a Home Valuation Report for This Property
The Home Valuation Report is an in-depth analysis detailing your home's value as well as a comparison with similar homes in the area
Home Values in the Area
Average Home Value in this Area
Purchase History
| Date | Buyer | Sale Price | Title Company |
|---|---|---|---|
| Carter Gwendolyn R | $96,000 | Western Reserve Title Agency | |
| Cresthaven Development | $44,000 | Western Reserve Title Ag | |
| Patfield Cindy A | $35,000 | -- | |
| Cuthill John | -- | -- | |
| Cuthill Esther A | -- | -- |
Source: Public Records
Mortgage History
| Date | Status | Borrower | Loan Amount |
|---|---|---|---|
| Open | Carter Gwendolyn R | $90,000 | |
| Closed | Carter Gwendolyn R | $5,000 |
Source: Public Records
Tax History Compared to Growth
Tax History
| Year | Tax Paid | Tax Assessment Tax Assessment Total Assessment is a certain percentage of the fair market value that is determined by local assessors to be the total taxable value of land and additions on the property. | Land | Improvement |
|---|---|---|---|---|
| 2024 | $2,242 | $34,195 | $5,460 | $28,735 |
| 2023 | $1,537 | $20,270 | $3,820 | $16,450 |
| 2022 | $1,529 | $20,265 | $3,815 | $16,450 |
| 2021 | $1,513 | $20,270 | $3,820 | $16,450 |
| 2020 | $1,535 | $17,780 | $3,360 | $14,420 |
| 2019 | $1,420 | $50,800 | $9,600 | $41,200 |
| 2018 | $1,445 | $17,780 | $3,360 | $14,420 |
| 2017 | $1,487 | $18,030 | $3,220 | $14,810 |
| 2016 | $1,475 | $18,030 | $3,220 | $14,810 |
| 2015 | $1,269 | $18,030 | $3,220 | $14,810 |
| 2014 | $1,269 | $9,690 | $3,710 | $5,980 |
Source: Public Records
Map
Nearby Homes
- 17216 Grovewood Ave
- 1166 E 176th St
- 1068 E 177th St
- 1113 E 177th St
- 1040 E 177th St
- 1230 E 173rd St
- 1080 E 167th St
- 17702 Nottingham Rd
- 17817 Grovewood Ave
- 1268 E 169th St
- 1261 E 167th St
- 17639 Wildwood Ln Unit 17639
- 17633 Wildwood Ln Unit 311
- 983 E 179th St
- 16215 Huntmere Ave
- 17610 Wildwood Ln Unit 315
- 16207 Arcade Ave
- 15914 Corsica Ave
- 15901 Pythias Ave
- 18024 Marcella Rd
- 1141 E 172nd St
- 1149 E 172nd St
- 1137 E 172nd St
- 1153 E 172nd St
- 1133 E 172nd St
- 1144 E 174th St
- 1148 E 174th St
- 1138 E 174th St
- 1138 E 174th St Unit B
- 1138 E 174th St Unit A
- 1129 E 172nd St
- 1154 E 174th St
- 1146 E 172nd St
- 1134 E 174th St
- 1142 E 172nd St
- 1150 E 172nd St
- 17209 Grovewood Ave
- 1154 E 172nd St
- 1138 E 172nd St
- 17201 Grovewood Ave