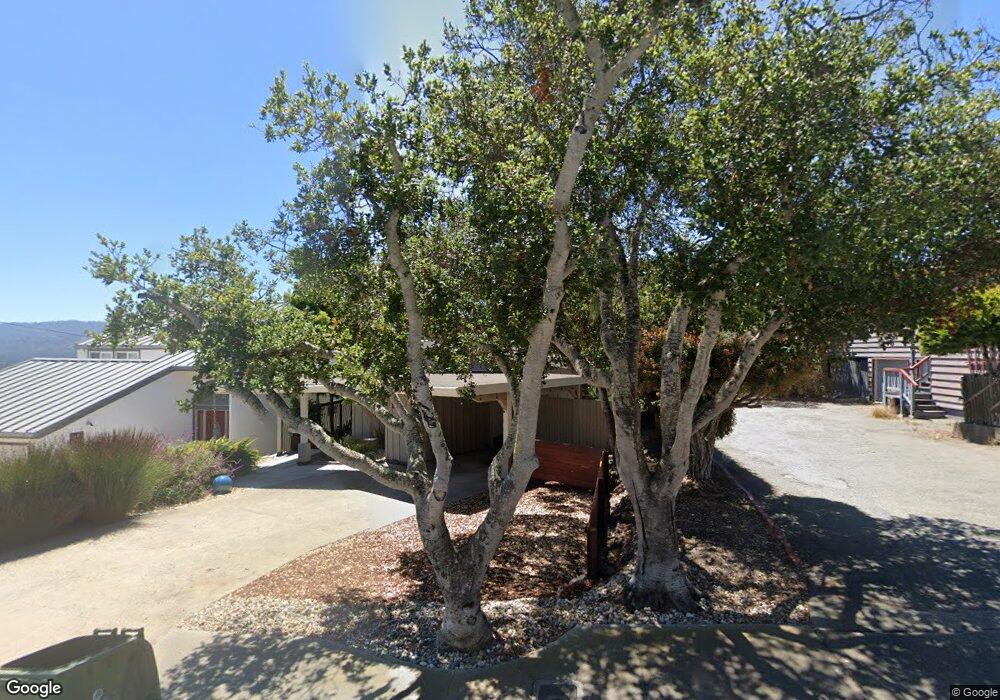
1145 Harrison St Monterey, CA 93940
Old Town NeighborhoodEstimated Value: $1,361,609 - $1,683,000
3
Beds
2
Baths
1,598
Sq Ft
$932/Sq Ft
Est. Value
About This Home
This home is located at 1145 Harrison St, Monterey, CA 93940 and is currently estimated at $1,489,902, approximately $932 per square foot. 1145 Harrison St is a home located in Monterey County with nearby schools including Monte Vista Elementary School, Monte Vista Middle School, and Monterey High School.
Ownership History
Date
Name
Owned For
Owner Type
Purchase Details
Closed on
Aug 26, 2005
Sold by
Mills Lawrence A and Mills Ellen D
Bought by
Crampton Kelly G and Ward Robin
Current Estimated Value
Home Financials for this Owner
Home Financials are based on the most recent Mortgage that was taken out on this home.
Original Mortgage
$741,750
Outstanding Balance
$394,841
Interest Rate
5.77%
Mortgage Type
Purchase Money Mortgage
Estimated Equity
$1,095,061
Purchase Details
Closed on
Dec 6, 1996
Sold by
Mills Lawrence A and Mills Ellen D
Bought by
Mills Lawrence A and Mills Ellen D
Purchase Details
Closed on
Apr 20, 1995
Sold by
Johnson Caroline H and The Caroline H Johnson Living
Bought by
Mills Lawrence A and Mills Ellen D
Home Financials for this Owner
Home Financials are based on the most recent Mortgage that was taken out on this home.
Original Mortgage
$230,000
Interest Rate
8.44%
Create a Home Valuation Report for This Property
The Home Valuation Report is an in-depth analysis detailing your home's value as well as a comparison with similar homes in the area
Home Values in the Area
Average Home Value in this Area
Purchase History
| Date | Buyer | Sale Price | Title Company |
|---|---|---|---|
| Crampton Kelly G | $989,000 | Old Republic Title | |
| Mills Lawrence A | -- | -- | |
| Mills Lawrence A | -- | -- | |
| Mills Lawrence A | $330,000 | Old Republic Title Company |
Source: Public Records
Mortgage History
| Date | Status | Borrower | Loan Amount |
|---|---|---|---|
| Open | Crampton Kelly G | $741,750 | |
| Previous Owner | Mills Lawrence A | $230,000 |
Source: Public Records
Tax History Compared to Growth
Tax History
| Year | Tax Paid | Tax Assessment Tax Assessment Total Assessment is a certain percentage of the fair market value that is determined by local assessors to be the total taxable value of land and additions on the property. | Land | Improvement |
|---|---|---|---|---|
| 2025 | $13,227 | $1,240,000 | $750,000 | $490,000 |
| 2024 | $13,227 | $1,240,000 | $750,000 | $490,000 |
| 2023 | $12,016 | $1,215,000 | $614,000 | $601,000 |
| 2022 | $11,031 | $1,005,000 | $508,000 | $497,000 |
| 2021 | $9,098 | $823,000 | $416,000 | $407,000 |
| 2020 | $8,706 | $810,000 | $410,000 | $400,000 |
| 2019 | $9,113 | $792,000 | $400,000 | $392,000 |
| 2018 | $8,866 | $787,000 | $398,000 | $389,000 |
| 2017 | $7,616 | $715,000 | $361,000 | $354,000 |
| 2016 | $7,175 | $672,000 | $340,000 | $332,000 |
| 2015 | $7,158 | $670,000 | $339,000 | $331,000 |
| 2014 | $6,034 | $562,000 | $284,000 | $278,000 |
Source: Public Records
Map
Nearby Homes
- 1139 Harrison St
- 1155 Harrison St
- 1129 Harrison St
- 1121 Harrison St
- 1140 Harrison St
- 1165 Harrison St
- 1150 Harrison St
- 1122 Harrison St
- 1111 Harrison St
- 1168 Harrison St
- 1177 Harrison St
- 1141 Roosevelt St
- 1155 Roosevelt St
- 1121 Roosevelt St
- 1106 Harrison St
- 1101 Harrison St
- 1187 Harrison St
- 1165 Roosevelt St
- 1176 Harrison St
- 472 Cedar St