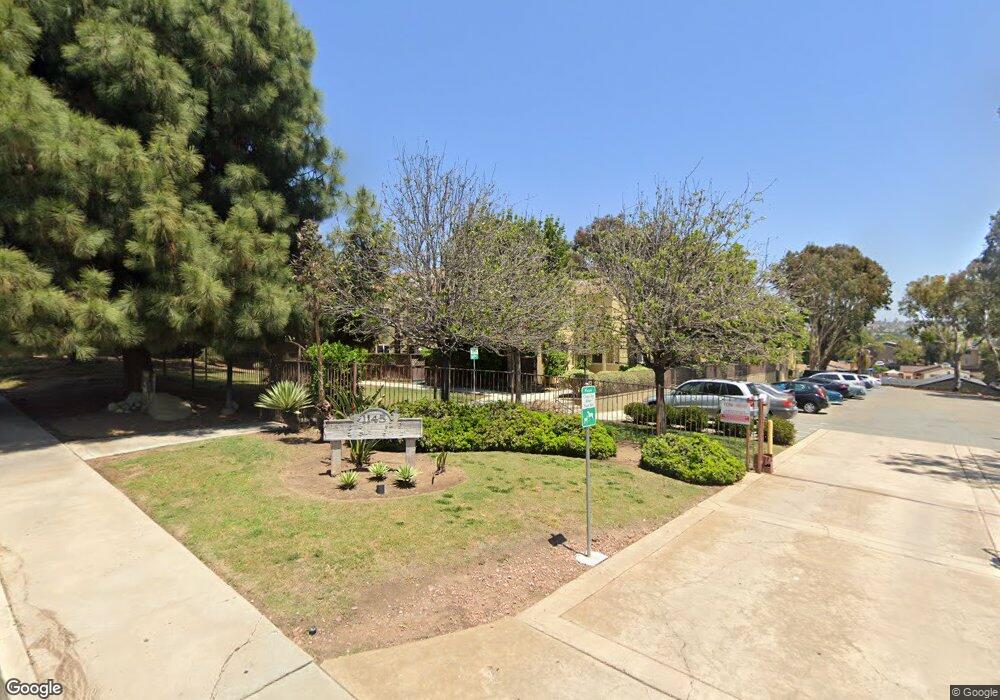
1145 Helix St Unit 7 Spring Valley, CA 91977
Estimated Value: $400,815 - $457,000
2
Beds
2
Baths
824
Sq Ft
$516/Sq Ft
Est. Value
About This Home
This home is located at 1145 Helix St Unit 7, Spring Valley, CA 91977 and is currently estimated at $425,454, approximately $516 per square foot. 1145 Helix St Unit 7 is a home located in San Diego County with nearby schools including Science, Technology, Engineering, Arts, And Math Academy, Kempton Literacy Academy, and Mount Miguel High School.
Ownership History
Date
Name
Owned For
Owner Type
Purchase Details
Closed on
Aug 2, 2024
Sold by
Liang Gorden and Liang Krystal
Bought by
Liang Family Trust and Liang
Current Estimated Value
Purchase Details
Closed on
May 11, 2009
Sold by
Bank Of America National Association
Bought by
Liang Gorden and Liang Krystal
Purchase Details
Closed on
Oct 16, 2008
Sold by
Rogers Jerry
Bought by
Lasalle Bank Na
Purchase Details
Closed on
Jul 12, 2006
Sold by
Rogers Jerry
Bought by
Wilburn Eula T
Purchase Details
Closed on
Aug 6, 2004
Sold by
Hawley Joseph M and Hawley Erica K
Bought by
Rogers Jerry
Home Financials for this Owner
Home Financials are based on the most recent Mortgage that was taken out on this home.
Original Mortgage
$260,000
Interest Rate
6.75%
Mortgage Type
Purchase Money Mortgage
Purchase Details
Closed on
Jul 8, 2004
Sold by
Helix Coastal Llc
Bought by
Hawley Joseph M and Hawley Erica K
Home Financials for this Owner
Home Financials are based on the most recent Mortgage that was taken out on this home.
Original Mortgage
$260,000
Interest Rate
6.75%
Mortgage Type
Purchase Money Mortgage
Create a Home Valuation Report for This Property
The Home Valuation Report is an in-depth analysis detailing your home's value as well as a comparison with similar homes in the area
Home Values in the Area
Average Home Value in this Area
Purchase History
| Date | Buyer | Sale Price | Title Company |
|---|---|---|---|
| Liang Family Trust | -- | None Listed On Document | |
| Liang Gorden | $75,000 | Corinthian Title Company | |
| Lasalle Bank Na | $145,000 | Accommodation | |
| Wilburn Eula T | -- | None Available | |
| Rogers Jerry | $325,000 | Commerce Title Company | |
| Hawley Joseph M | $266,000 | Chicago Title Co |
Source: Public Records
Mortgage History
| Date | Status | Borrower | Loan Amount |
|---|---|---|---|
| Previous Owner | Rogers Jerry | $260,000 | |
| Previous Owner | Hawley Joseph M | $212,800 | |
| Closed | Hawley Joseph M | $53,200 | |
| Closed | Rogers Jerry | $48,750 |
Source: Public Records
Tax History Compared to Growth
Tax History
| Year | Tax Paid | Tax Assessment Tax Assessment Total Assessment is a certain percentage of the fair market value that is determined by local assessors to be the total taxable value of land and additions on the property. | Land | Improvement |
|---|---|---|---|---|
| 2025 | $1,752 | $96,564 | $51,502 | $45,062 |
| 2024 | $1,752 | $94,672 | $50,493 | $44,179 |
| 2023 | $1,688 | $92,816 | $49,503 | $43,313 |
| 2022 | $1,646 | $90,997 | $48,533 | $42,464 |
| 2021 | $1,638 | $89,214 | $47,582 | $41,632 |
| 2020 | $1,560 | $88,301 | $47,095 | $41,206 |
| 2019 | $1,536 | $86,571 | $46,172 | $40,399 |
| 2018 | $1,465 | $84,874 | $45,267 | $39,607 |
| 2017 | $1,406 | $83,211 | $44,380 | $38,831 |
| 2016 | $1,340 | $81,580 | $43,510 | $38,070 |
| 2015 | $1,328 | $80,356 | $42,857 | $37,499 |
| 2014 | $1,310 | $78,783 | $42,018 | $36,765 |
Source: Public Records
Map
Nearby Homes
- 1145 Helix St Unit 4
- 1145 Helix St Unit 1
- 1040 Gillespie Dr
- 1034 Leland St Unit 15
- 1034 Leland St Unit 14
- 8886 Margaret Ct
- 8739 Saint George St
- 969 985 Gillespie Dr
- 8603 Eileen St
- 8764 Orville St
- 1830 Helix St
- 1604 Presioca St Unit 23
- 9208 Harness St
- 1632 Presioca St Unit 15
- 1815 Sweetwater Rd Unit SPC 121
- 1815 Sweetwater Rd Unit 37
- 1815 Sweetwater Rd Unit SPC 48
- 1815 Sweetwater Rd Unit SPC 120
- 1815 Sweetwater Rd Unit 111
- 1815 Sweetwater Rd Unit 22
- 1145 Helix St Unit 16
- 1145 Helix St Unit 15
- 1145 Helix St Unit 14
- 1145 Helix St Unit 13
- 1145 Helix St Unit 12
- 1145 Helix St Unit 11
- 1145 Helix St Unit 9
- 1145 Helix St Unit 8
- 1145 Helix St Unit 6
- 1145 Helix St Unit 5
- 1145 Helix St Unit 2
- 1145 Helix St Unit 10
- 1135 Helix St
- 1207 Helix St
- 1134 Jamacha Ln
- 1138 Jamacha Ln Unit 1140
- 1138 Jamacha Ln Unit 40
- 1117 Helix St
- 1134-36 Jamacha Ln
- 1126 Jamacha Ln Unit 32