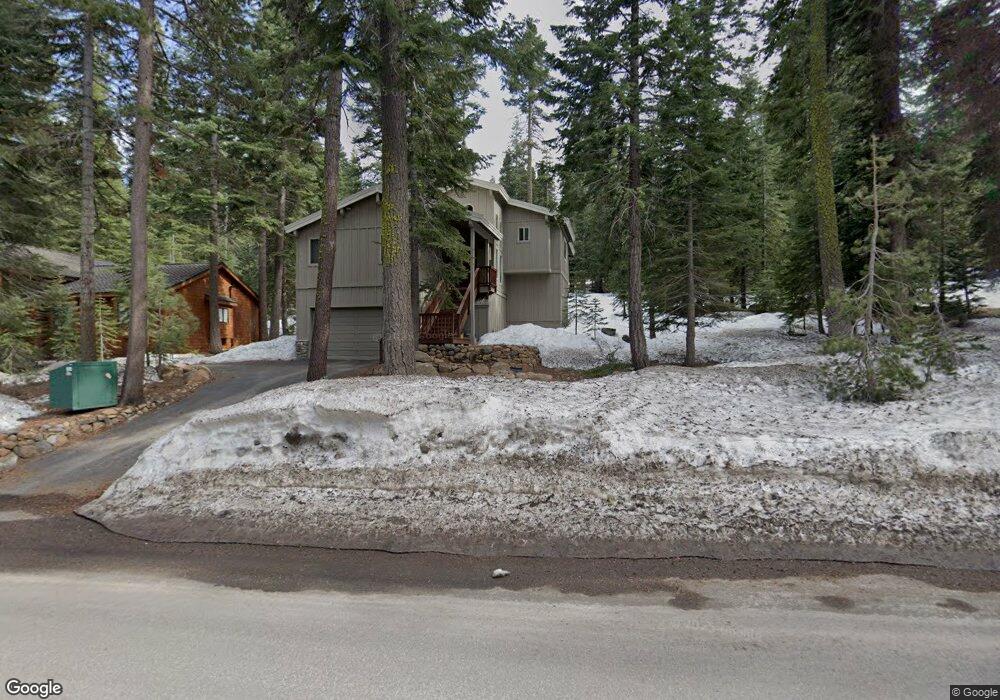
1145 Regency Way Tahoe Vista, CA 96148
Estimated Value: $852,000 - $1,270,000
3
Beds
3
Baths
1,846
Sq Ft
$610/Sq Ft
Est. Value
About This Home
This home is located at 1145 Regency Way, Tahoe Vista, CA 96148 and is currently estimated at $1,126,129, approximately $610 per square foot. 1145 Regency Way is a home with nearby schools including Kings Beach Elementary School, North Tahoe School, and North Tahoe High School.
Ownership History
Date
Name
Owned For
Owner Type
Purchase Details
Closed on
Aug 26, 2014
Sold by
Adler Dannielle and Adler Md Richard H
Bought by
Adler Dannielle and Adler Richard H
Current Estimated Value
Purchase Details
Closed on
Jan 20, 1997
Sold by
Adler Richard H and Adler Paula Mary
Bought by
Adler Md Richard H and Adler Mary Paula
Purchase Details
Closed on
Nov 29, 1994
Sold by
Adler Dannielle and Adler Richard H
Bought by
Adler Dannielle and Adler Richard H
Purchase Details
Closed on
Sep 8, 1994
Sold by
Wagner Richard J
Bought by
Adler Dannielle and Adler Richard H
Home Financials for this Owner
Home Financials are based on the most recent Mortgage that was taken out on this home.
Original Mortgage
$168,700
Interest Rate
6.37%
Mortgage Type
Purchase Money Mortgage
Create a Home Valuation Report for This Property
The Home Valuation Report is an in-depth analysis detailing your home's value as well as a comparison with similar homes in the area
Home Values in the Area
Average Home Value in this Area
Purchase History
| Date | Buyer | Sale Price | Title Company |
|---|---|---|---|
| Adler Dannielle | -- | None Available | |
| Adler Md Richard H | -- | -- | |
| Adler Dannielle | -- | Fidelity National Title | |
| Adler Dannielle | $102,000 | Fidelity National Title |
Source: Public Records
Mortgage History
| Date | Status | Borrower | Loan Amount |
|---|---|---|---|
| Previous Owner | Adler Dannielle | $168,700 |
Source: Public Records
Tax History Compared to Growth
Tax History
| Year | Tax Paid | Tax Assessment Tax Assessment Total Assessment is a certain percentage of the fair market value that is determined by local assessors to be the total taxable value of land and additions on the property. | Land | Improvement |
|---|---|---|---|---|
| 2025 | $4,596 | $344,122 | $24,066 | $320,056 |
| 2023 | $4,596 | $330,762 | $23,133 | $307,629 |
| 2022 | $4,348 | $324,278 | $22,680 | $301,598 |
| 2021 | $4,199 | $317,921 | $22,236 | $295,685 |
| 2020 | $4,192 | $314,662 | $22,008 | $292,654 |
| 2019 | $4,222 | $308,493 | $21,577 | $286,916 |
| 2018 | $3,803 | $302,445 | $21,154 | $281,291 |
| 2017 | $3,729 | $296,516 | $20,740 | $275,776 |
| 2016 | $3,682 | $290,703 | $20,334 | $270,369 |
| 2015 | $3,608 | $286,337 | $20,029 | $266,308 |
| 2014 | $3,507 | $280,729 | $19,637 | $261,092 |
Source: Public Records
Map
Nearby Homes
- 1163 Statford Way
- 1359 Kings Way
- 1187 Regency Way
- 1352 Kings Way
- 1357 Kings Way
- 1420 Cheshire Ct
- 1408 Cheshire Ct
- 400 Estates Dr
- 1300 Regency Way Unit 92
- 1300 Regency Way Unit 33
- 1300 Regency Way Unit 37
- 298 Estates Dr
- 200 Rim Dr
- 6971 Grey Ln
- 6099 Dodowah Rd
- 560 Granite Rd
- 573 Granite Rd
- 6750 N North Lake Blvd Unit 14C
- 6750 N North Lake Blvd Unit 9B
- 6750 N North Lake Blvd Unit 10B
- 1143 Regency Way
- 1147 Regency Way
- 1140 Regency Way
- 1141 Regency Way
- 1138 Regency Way
- 1152 Statford Way
- 1141 Regency Way
- 1150 Statford Way
- 1149 Regency Way
- 1154 Statford Way
- 1142 Regency Way
- 1136 Regency Way
- 1156 Statford Way
- 1144 Regency Way
- 1134 Regency Way
- 1146 Statford Way
- 1151 Regency Way
- 1160 Statford Way
- 1132 Regency Way
- 1174 Statford Way