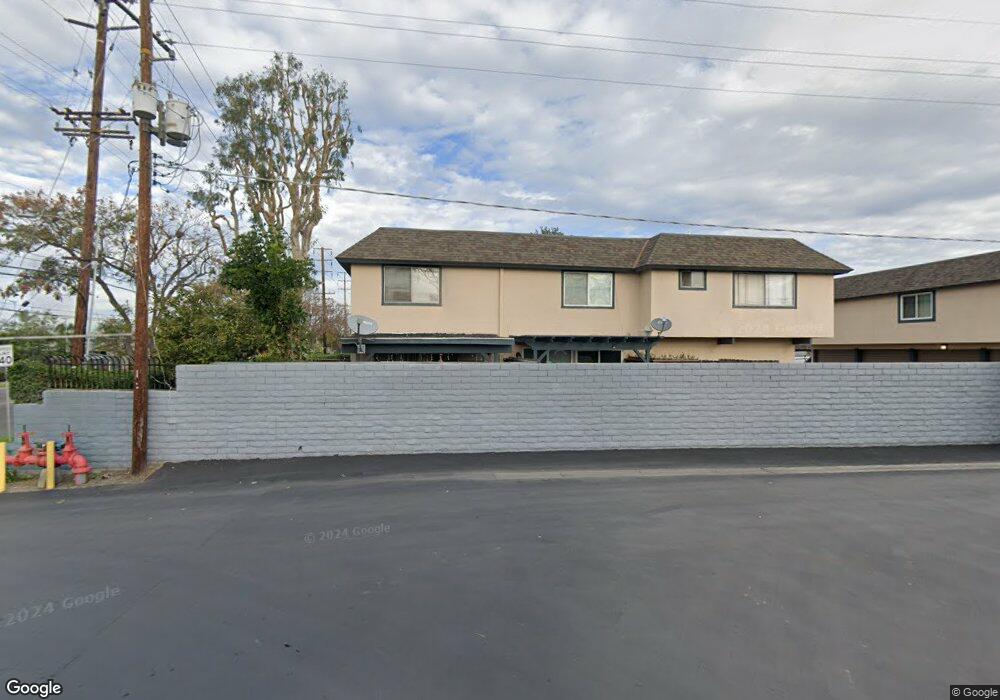
1145 S Clifpark Cir Unit 15 Anaheim, CA 92805
Southeast Anaheim NeighborhoodEstimated Value: $566,000 - $712,000
2
Beds
2
Baths
1,043
Sq Ft
$582/Sq Ft
Est. Value
About This Home
This home is located at 1145 S Clifpark Cir Unit 15, Anaheim, CA 92805 and is currently estimated at $607,058, approximately $582 per square foot. 1145 S Clifpark Cir Unit 15 is a home located in Orange County with nearby schools including Theodore Roosevelt Elementary School, South Junior High School, and Katella High School.
Ownership History
Date
Name
Owned For
Owner Type
Purchase Details
Closed on
Dec 12, 2022
Sold by
Castelan-Armas Edgar Ruben
Bought by
Edgar Ruben Castelan-Armas Living Trust
Current Estimated Value
Purchase Details
Closed on
Feb 9, 2004
Sold by
Nelson Michael W and Nelson Sara E
Bought by
Castelan Serafin
Home Financials for this Owner
Home Financials are based on the most recent Mortgage that was taken out on this home.
Original Mortgage
$189,000
Interest Rate
5.12%
Mortgage Type
Purchase Money Mortgage
Purchase Details
Closed on
Nov 15, 2001
Sold by
Croddy David and Croddy Barbara W
Bought by
Nelson Michael W and Nelson Sara E
Home Financials for this Owner
Home Financials are based on the most recent Mortgage that was taken out on this home.
Original Mortgage
$145,500
Interest Rate
6.63%
Mortgage Type
FHA
Create a Home Valuation Report for This Property
The Home Valuation Report is an in-depth analysis detailing your home's value as well as a comparison with similar homes in the area
Home Values in the Area
Average Home Value in this Area
Purchase History
| Date | Buyer | Sale Price | Title Company |
|---|---|---|---|
| Edgar Ruben Castelan-Armas Living Trust | -- | -- | |
| Castelan Serafin | $270,000 | Fidelity National Title | |
| Nelson Michael W | $150,000 | Orange Coast Title |
Source: Public Records
Mortgage History
| Date | Status | Borrower | Loan Amount |
|---|---|---|---|
| Previous Owner | Castelan Serafin | $189,000 | |
| Previous Owner | Nelson Michael W | $145,500 | |
| Closed | Castelan Serafin | $54,000 |
Source: Public Records
Tax History Compared to Growth
Tax History
| Year | Tax Paid | Tax Assessment Tax Assessment Total Assessment is a certain percentage of the fair market value that is determined by local assessors to be the total taxable value of land and additions on the property. | Land | Improvement |
|---|---|---|---|---|
| 2025 | $5,831 | $512,460 | $421,281 | $91,179 |
| 2024 | $5,831 | $502,412 | $413,020 | $89,392 |
| 2023 | $5,707 | $492,561 | $404,921 | $87,640 |
| 2022 | $4,918 | $418,200 | $348,776 | $69,424 |
| 2021 | $4,925 | $410,000 | $341,937 | $68,063 |
| 2020 | $4,586 | $378,000 | $309,937 | $68,063 |
| 2019 | $4,533 | $378,000 | $309,937 | $68,063 |
| 2018 | $4,522 | $378,000 | $309,937 | $68,063 |
| 2017 | $3,787 | $320,000 | $251,937 | $68,063 |
| 2016 | $3,844 | $320,000 | $251,937 | $68,063 |
| 2015 | $3,401 | $279,000 | $210,937 | $68,063 |
| 2014 | $2,998 | $255,266 | $187,203 | $68,063 |
Source: Public Records
Map
Nearby Homes
- 1101 S Clifpark Cir
- 2144 E Almont Ave
- 617 E Eton Place
- 611 E Eton Place
- 1415 E South St
- 1615 E South St
- 725 S Mosaic St
- 760 S Olive St
- 1206 W Cara Dr
- 1539 W Cara Dr
- 1638 S Urbana St
- 1422 S Urbana St
- 1020 S Cambridge St
- 651 E Valencia St
- 1403 W Bushell St
- 842 S Anaheim Blvd
- 1407 W Bushell St
- 1522 S Urbana St
- 1414 S Urbana St
- 1415 W Cara Dr
- 1147 S Clifpark Cir Unit 16
- 1143 S Clifpark Cir Unit 14
- 1149 S Clifpark Cir Unit 17N
- 1148 S Clifpark Cir Unit 21R
- 1141 S Clifpark Cir Unit 13
- 1139 S Clifpark Cir Unit 12E
- 1150 S Clifpark Cir Unit 20Q
- 1150 S Clifpark Cir
- 1137 S Clifpark Cir Unit 11D
- 1152 S Clifpark Cir Unit 19p
- 1152 S Clifpark Cir
- 1135 S Clifpark Cir Unit 10C
- 1135 S Clifpark Cir
- 1133 S Clifpark Cir Unit 9
- 1154 S Clifpark Cir Unit 18
- 1131 S Clifpark Cir Unit 8H
- 1146 S Clifpark Cir
- 1140 S Clifpark Cir
- 1144 S Clifpark Cir
- 1138 S Clifpark Cir Unit 30S