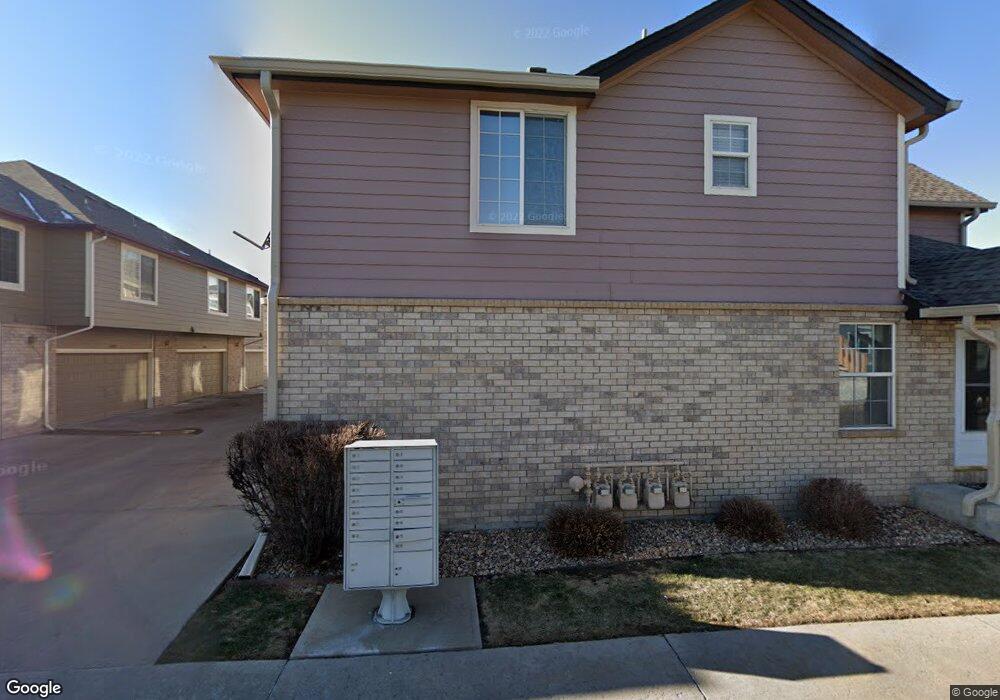
1145 W 112th Ave Unit B Denver, CO 80234
The Ranch NeighborhoodEstimated Value: $393,273 - $415,000
2
Beds
3
Baths
1,475
Sq Ft
$273/Sq Ft
Est. Value
About This Home
This home is located at 1145 W 112th Ave Unit B, Denver, CO 80234 and is currently estimated at $402,818, approximately $273 per square foot. 1145 W 112th Ave Unit B is a home located in Adams County with nearby schools including Cotton Creek Elementary School, Silver Hills Middle School, and Northglenn High School.
Ownership History
Date
Name
Owned For
Owner Type
Purchase Details
Closed on
Apr 16, 2021
Sold by
Killeen Barbara M
Bought by
Mahmassani Wissam and Jawhar Nada
Current Estimated Value
Home Financials for this Owner
Home Financials are based on the most recent Mortgage that was taken out on this home.
Original Mortgage
$278,625
Outstanding Balance
$251,224
Interest Rate
3.05%
Mortgage Type
New Conventional
Estimated Equity
$151,594
Purchase Details
Closed on
Sep 25, 2019
Sold by
Inoue Mariko
Bought by
Killeen Barbara M
Purchase Details
Closed on
Aug 24, 2012
Sold by
Molliconi Sandra L
Bought by
Inoue Mariko
Purchase Details
Closed on
May 27, 1999
Sold by
D R Horton Inc Denver
Bought by
Molliconi Sandra L
Home Financials for this Owner
Home Financials are based on the most recent Mortgage that was taken out on this home.
Original Mortgage
$136,840
Interest Rate
6.92%
Mortgage Type
FHA
Create a Home Valuation Report for This Property
The Home Valuation Report is an in-depth analysis detailing your home's value as well as a comparison with similar homes in the area
Home Values in the Area
Average Home Value in this Area
Purchase History
| Date | Buyer | Sale Price | Title Company |
|---|---|---|---|
| Mahmassani Wissam | $371,500 | Land Title Guarantee | |
| Killeen Barbara M | $325,000 | Heritage Title Co | |
| Inoue Mariko | $178,000 | First American | |
| Molliconi Sandra L | $140,855 | -- |
Source: Public Records
Mortgage History
| Date | Status | Borrower | Loan Amount |
|---|---|---|---|
| Open | Mahmassani Wissam | $278,625 | |
| Previous Owner | Molliconi Sandra L | $136,840 |
Source: Public Records
Tax History Compared to Growth
Tax History
| Year | Tax Paid | Tax Assessment Tax Assessment Total Assessment is a certain percentage of the fair market value that is determined by local assessors to be the total taxable value of land and additions on the property. | Land | Improvement |
|---|---|---|---|---|
| 2024 | $2,155 | $25,440 | $5,000 | $20,440 |
| 2023 | $2,131 | $26,790 | $4,740 | $22,050 |
| 2022 | $2,183 | $21,830 | $4,310 | $17,520 |
| 2021 | $2,254 | $21,830 | $4,310 | $17,520 |
| 2020 | $2,179 | $21,500 | $4,430 | $17,070 |
| 2019 | $2,141 | $21,080 | $4,430 | $16,650 |
| 2018 | $1,949 | $18,590 | $1,160 | $17,430 |
| 2017 | $1,755 | $18,590 | $1,160 | $17,430 |
| 2016 | $1,435 | $14,760 | $1,280 | $13,480 |
| 2015 | $1,433 | $14,760 | $1,280 | $13,480 |
| 2014 | -- | $12,440 | $1,280 | $11,160 |
Source: Public Records
Map
Nearby Homes
- 1113 W 112th Ave Unit A
- 1185 W 112th Ave Unit C
- 1097 W 112th Ave Unit D
- 1089 W 112th Ave Unit D
- 11301 Navajo Cir Unit B
- 11251 Osage Cir Unit E
- 1665 W 113th Ave
- 11485 Pecos St
- 1667 W 115th Cir
- 553 W 114th Way
- 2114 Ranch Dr
- 11202 Wyandot St
- 2347 Ranch Dr
- 10951 Acoma St
- 1421 W 106th Ave
- 120 Leonard Ln
- 10544 Carmela Ln
- 11632 Community Center Dr Unit 53
- 10724 Tancred St
- 13507 Huron St
- 1145 W 112th Ave Unit C
- 1145 W 112th Ave Unit A
- 1145 W 112th Ave
- 1121 W 112th Ave Unit D
- 1121 W 112th Ave Unit C
- 1121 W 112th Ave Unit B
- 1121 W 112th Ave Unit A
- 1129 W 112th Ave Unit D
- 1129 W 112th Ave Unit B
- 1129 W 112th Ave Unit 1
- 1129 W 112th Ave Unit 7A
- 1169 W 112th Ave Unit D
- 1169 W 112th Ave Unit C
- 1169 W 112th Ave Unit B
- 1169 W 112th Ave Unit A
- 1169 W 112th Ave
- 1077 W 112th Ave Unit D
- 1077 W 112th Ave Unit C
- 1077 W 112th Ave Unit B
- 1077 W 112th Ave Unit A