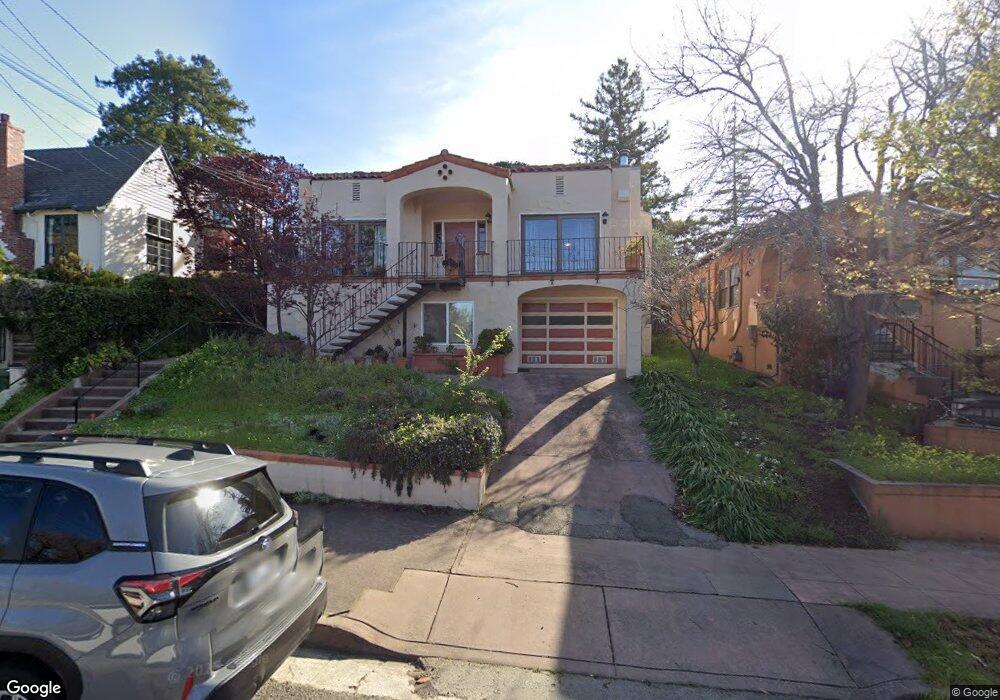
1145 Walnut St Berkeley, CA 94707
Berkeley Hills NeighborhoodEstimated Value: $1,942,000 - $2,428,000
4
Beds
3
Baths
2,335
Sq Ft
$920/Sq Ft
Est. Value
About This Home
This home is located at 1145 Walnut St, Berkeley, CA 94707 and is currently estimated at $2,147,050, approximately $919 per square foot. 1145 Walnut St is a home located in Alameda County with nearby schools including Berkeley Arts Magnet at Whittier School, Cragmont Elementary School, and Washington Elementary School.
Ownership History
Date
Name
Owned For
Owner Type
Purchase Details
Closed on
May 15, 2024
Sold by
Big Signal Llc
Bought by
Big Signal Llc
Current Estimated Value
Purchase Details
Closed on
Apr 2, 2021
Sold by
Mann Melvin Marvin and The Mann Family Trust Trust A
Bought by
Big Signal Llc
Purchase Details
Closed on
May 26, 1998
Sold by
Mann Melvin M
Bought by
Mann Melvin Marvin and Mann Family Trust
Purchase Details
Closed on
Oct 17, 1985
Sold by
Mann Melvin M and Mann Paula
Bought by
Melvin Marvin & Paula Mann Family Trust
Create a Home Valuation Report for This Property
The Home Valuation Report is an in-depth analysis detailing your home's value as well as a comparison with similar homes in the area
Home Values in the Area
Average Home Value in this Area
Purchase History
| Date | Buyer | Sale Price | Title Company |
|---|---|---|---|
| Big Signal Llc | -- | None Listed On Document | |
| Big Signal Llc | $1,780,000 | Chicago Title Company | |
| Mann Melvin Marvin | -- | -- | |
| Melvin Marvin & Paula Mann Family Trust | -- | -- |
Source: Public Records
Tax History
| Year | Tax Paid | Tax Assessment Tax Assessment Total Assessment is a certain percentage of the fair market value that is determined by local assessors to be the total taxable value of land and additions on the property. | Land | Improvement |
|---|---|---|---|---|
| 2025 | $27,795 | $1,926,707 | $578,012 | $1,348,695 |
| 2024 | $27,795 | $1,888,935 | $566,680 | $1,322,255 |
| 2023 | $27,157 | $1,851,911 | $555,573 | $1,296,338 |
| 2022 | $26,668 | $1,815,600 | $544,680 | $1,270,920 |
| 2021 | $5,649 | $91,077 | $55,947 | $42,130 |
| 2020 | $5,134 | $97,072 | $55,374 | $41,698 |
| 2019 | $4,691 | $95,169 | $54,288 | $40,881 |
| 2018 | $4,540 | $93,303 | $53,224 | $40,079 |
| 2017 | $4,351 | $91,473 | $52,180 | $39,293 |
| 2016 | $4,032 | $89,680 | $51,157 | $38,523 |
| 2015 | $3,942 | $88,333 | $50,389 | $37,944 |
| 2014 | $3,787 | $86,603 | $49,402 | $37,201 |
Source: Public Records
Map
Nearby Homes
- 2121 Eunice St
- 2315 Eunice St
- 1950 Hopkins St
- 1004 Cragmont Ave
- 938 San Benito Rd
- 1408 Henry St
- 1444 Walnut St
- 2501 Rose Walk
- 1515 Oxford St Unit 1D
- 1106 Cragmont Ave
- 1425 Martin Luther King jr Way
- 962 Regal Rd
- 813 San Diego Rd
- 1841 Vine St
- 2686 Shasta Rd
- 1622 Scenic Ave
- 1165 Cragmont Ave
- 1610 Milvia St
- 2421 Hilgard Ave
- 1682 Oxford St
Your Personal Tour Guide
Ask me questions while you tour the home.