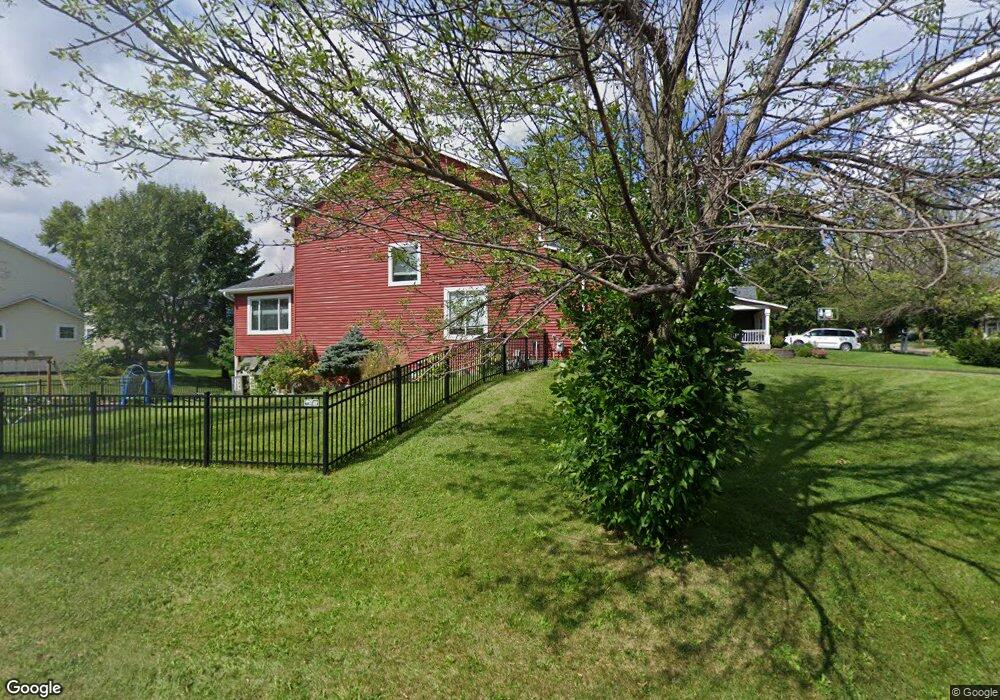
11453 Halstead Trail Woodbury, MN 55129
Estimated Value: $575,096 - $647,000
4
Beds
3
Baths
2,707
Sq Ft
$221/Sq Ft
Est. Value
About This Home
This home is located at 11453 Halstead Trail, Woodbury, MN 55129 and is currently estimated at $598,524, approximately $221 per square foot. 11453 Halstead Trail is a home located in Washington County with nearby schools including Liberty Ridge Elementary School, Lake Middle School, and East Ridge High School.
Ownership History
Date
Name
Owned For
Owner Type
Purchase Details
Closed on
Dec 30, 2021
Sold by
Paulson Christina and Paulson Adam
Bought by
Paulson Christina and Paulson Adam
Current Estimated Value
Home Financials for this Owner
Home Financials are based on the most recent Mortgage that was taken out on this home.
Original Mortgage
$285,608
Outstanding Balance
$263,223
Interest Rate
3.11%
Mortgage Type
New Conventional
Estimated Equity
$335,301
Purchase Details
Closed on
Feb 24, 2016
Sold by
Brookfield Relocation Inc
Bought by
Kloeckner Christina
Home Financials for this Owner
Home Financials are based on the most recent Mortgage that was taken out on this home.
Original Mortgage
$318,750
Interest Rate
3.92%
Mortgage Type
New Conventional
Purchase Details
Closed on
Feb 19, 2004
Sold by
Mattamy Minneapolis Partnership Llc
Bought by
Pope George R and Pope Jennifer L
Create a Home Valuation Report for This Property
The Home Valuation Report is an in-depth analysis detailing your home's value as well as a comparison with similar homes in the area
Home Values in the Area
Average Home Value in this Area
Purchase History
| Date | Buyer | Sale Price | Title Company |
|---|---|---|---|
| Paulson Christina | -- | None Available | |
| Kloeckner Christina | $375,000 | None Available | |
| Brookfield Relocation Inc | $375,000 | None Available | |
| Pope George R | $403,333 | -- |
Source: Public Records
Mortgage History
| Date | Status | Borrower | Loan Amount |
|---|---|---|---|
| Open | Paulson Christina | $285,608 | |
| Closed | Kloeckner Christina | $318,750 |
Source: Public Records
Tax History Compared to Growth
Tax History
| Year | Tax Paid | Tax Assessment Tax Assessment Total Assessment is a certain percentage of the fair market value that is determined by local assessors to be the total taxable value of land and additions on the property. | Land | Improvement |
|---|---|---|---|---|
| 2024 | $6,846 | $524,700 | $155,000 | $369,700 |
| 2023 | $6,846 | $540,600 | $177,000 | $363,600 |
| 2022 | $5,512 | $494,600 | $150,000 | $344,600 |
| 2021 | $5,352 | $412,200 | $125,000 | $287,200 |
| 2020 | $5,394 | $405,000 | $125,000 | $280,000 |
| 2019 | $5,468 | $400,300 | $112,500 | $287,800 |
| 2018 | $5,604 | $389,500 | $117,500 | $272,000 |
| 2017 | $4,952 | $393,000 | $122,000 | $271,000 |
| 2016 | $5,262 | $355,900 | $90,000 | $265,900 |
| 2015 | $4,948 | $377,700 | $104,200 | $273,500 |
| 2013 | -- | $326,700 | $73,900 | $252,800 |
Source: Public Records
Map
Nearby Homes
- 2844 Rosemill Cir
- 3015 Arden Dr
- 11344 Eagle View Terrace
- 3140 Legacy Ln
- 11080 Dogwood Ct
- 11212 Halstead Trail
- 3181 Frontier Dr
- 3143 Frontier Dr
- 11568 Ivywood Bay
- 11294 Ivywood Trail
- 11458 Balsam Way
- 11446 Balsam Way
- 11333 Ivywood Trail
- 11781 Harvest Path
- 3452 Mulberry Cir
- 2138 Vermillion Bay
- 3332 Hazel Trail Unit D
- 2518 Eyrie Dr
- 11006 James Curve
- 10712 Kingsfield Ln
- 11445 Halstead Trail
- 11477 Halstead Trail
- 11437 Halstead Trail
- 11485 Halstead Trail
- 11470 Halstead Trail
- 11454 Halstead Trail
- 11429 Halstead Trail
- 11446 Halstead Trail
- 11462 Halstead Trail
- 11438 Halstead Trail
- 11499 Halstead Trail
- 11421 Halstead Trail
- 11430 Halstead Trail
- 2815 Rosemill Ln
- 11422 Halstead Trail
- 11468 Waterview Way
- 11413 Halstead Trail
- 2807 Rosemill Ln
- 11414 Halstead Trail
- 11496 Waterview Way