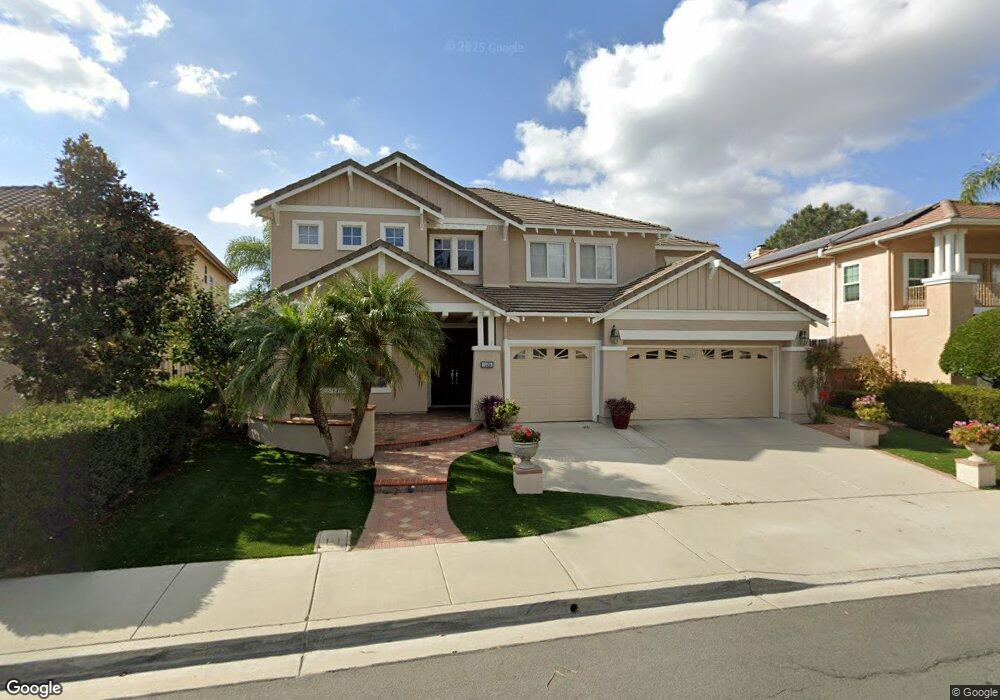
11454 Raedene Way San Diego, CA 92131
Miramar Ranch North NeighborhoodEstimated Value: $2,082,000 - $2,312,000
4
Beds
3
Baths
2,817
Sq Ft
$763/Sq Ft
Est. Value
About This Home
This home is located at 11454 Raedene Way, San Diego, CA 92131 and is currently estimated at $2,148,620, approximately $762 per square foot. 11454 Raedene Way is a home located in San Diego County with nearby schools including Miramar Ranch Elementary School, Thurgood Marshall Middle School, and Scripps Ranch High School.
Ownership History
Date
Name
Owned For
Owner Type
Purchase Details
Closed on
Dec 15, 2017
Sold by
Sundharadas Gnanasigamoni
Bought by
Sundharadas Renjit Allen
Current Estimated Value
Home Financials for this Owner
Home Financials are based on the most recent Mortgage that was taken out on this home.
Original Mortgage
$1,080,000
Outstanding Balance
$909,500
Interest Rate
3.95%
Mortgage Type
New Conventional
Estimated Equity
$1,239,120
Purchase Details
Closed on
May 5, 2011
Sold by
Sundharadas Gnanasigamoni and Sundharadas Nirmala
Bought by
Sundharadas Gnanasigamoni and Sundharadas Nirmala
Purchase Details
Closed on
Jan 15, 2002
Sold by
Kb Home Coastal Inc
Bought by
Sundharadas Gnanasigamoni and Sundharadas Nirmala
Home Financials for this Owner
Home Financials are based on the most recent Mortgage that was taken out on this home.
Original Mortgage
$483,150
Interest Rate
6.5%
Create a Home Valuation Report for This Property
The Home Valuation Report is an in-depth analysis detailing your home's value as well as a comparison with similar homes in the area
Home Values in the Area
Average Home Value in this Area
Purchase History
| Date | Buyer | Sale Price | Title Company |
|---|---|---|---|
| Sundharadas Renjit Allen | $1,200,000 | Ticor Title San Diego Branch | |
| Sundharadas Gnanasigamoni | -- | None Available | |
| Sundharadas Gnanasigamoni | -- | None Available | |
| Sundharadas Gnanasigamoni | $604,000 | First American Title |
Source: Public Records
Mortgage History
| Date | Status | Borrower | Loan Amount |
|---|---|---|---|
| Open | Sundharadas Renjit Allen | $1,080,000 | |
| Previous Owner | Sundharadas Gnanasigamoni | $483,150 |
Source: Public Records
Tax History Compared to Growth
Tax History
| Year | Tax Paid | Tax Assessment Tax Assessment Total Assessment is a certain percentage of the fair market value that is determined by local assessors to be the total taxable value of land and additions on the property. | Land | Improvement |
|---|---|---|---|---|
| 2025 | $11,621 | $937,620 | $258,519 | $679,101 |
| 2024 | $11,621 | $919,236 | $253,450 | $665,786 |
| 2023 | $11,354 | $901,213 | $248,481 | $652,732 |
| 2022 | $10,987 | $883,543 | $243,609 | $639,934 |
| 2021 | $10,898 | $866,220 | $238,833 | $627,387 |
| 2020 | $10,769 | $857,339 | $236,385 | $620,954 |
| 2019 | $10,555 | $840,529 | $231,750 | $608,779 |
| 2018 | $9,942 | $824,049 | $227,206 | $596,843 |
| 2017 | $9,629 | $807,892 | $222,751 | $585,141 |
| 2016 | $9,478 | $792,052 | $218,384 | $573,668 |
| 2015 | $9,341 | $780,155 | $215,104 | $565,051 |
| 2014 | $9,196 | $764,874 | $210,891 | $553,983 |
Source: Public Records
Map
Nearby Homes
- 11482 Cortina Place
- 11365 Affinity Ct Unit 192
- 11215 Affinity Ct Unit 80
- 9960 Scripps Vista Way Unit 116
- 11265 Affinity Ct Unit 103
- 11175 Affinity Ct Unit 45
- 11235 Affinity Ct Unit 68
- 11325 Affinity Ct Unit 151
- 11629 Swan Lake Dr Unit 4
- 11115 Affinity Ct Unit 1
- 11856 Miro Cir
- 9909 Scripps Westview Way Unit 212
- 11825 Miro Cir
- 9899 Scripps Westview Way Unit 243
- 9899 Scripps Westview Way Unit 244
- 9939 Erma Rd Unit 101
- 9959 Erma Rd Unit 104
- 9929 Erma Rd Unit 102
- 11061 Scripps Ranch Blvd
- 9471 Compass Point Dr S
- 11450 Raedene Way
- 11460 Raedene Way
- 11466 Raedene Way
- 11444 Raedene Way
- 11455 Raedene Way
- 11449 Raedene Way
- 11461 Raedene Way
- 11472 Raedene Way
- 11438 Raedene Way
- 11443 Raedene Way
- 10403 Blue Summit Ct
- 11467 Raedene Way
- 10395 Longdale Place
- 11478 Raedene Way
- 11437 Raedene Way
- 11432 Raedene Way
- 10409 Blue Summit Ct
- 11473 Raedene Way
- 11431 Raedene Way
- 11426 Raedene Way