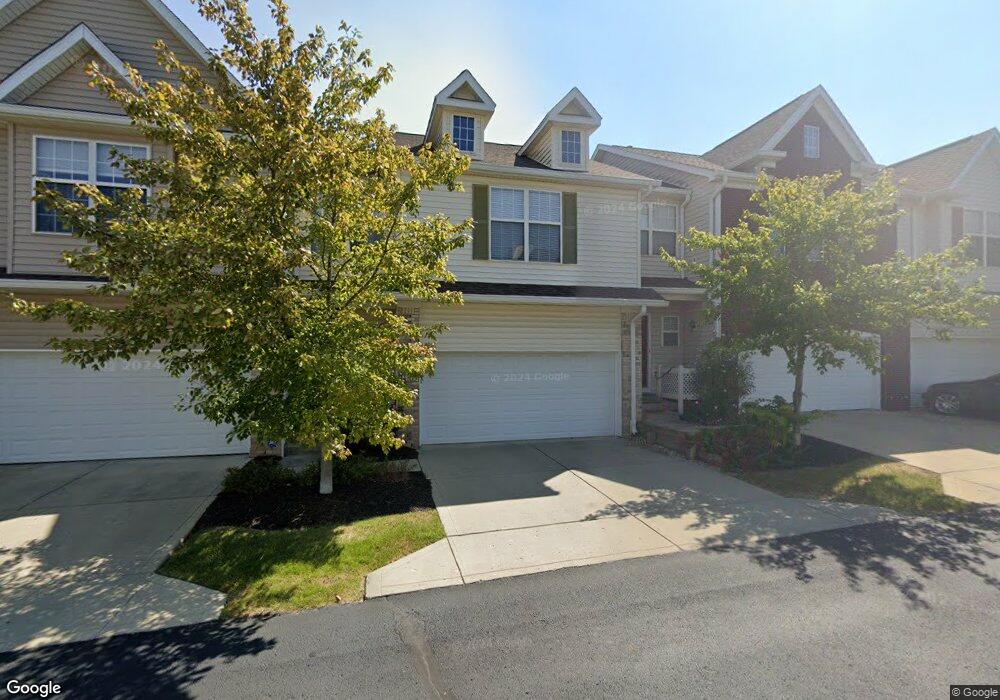
11455 Clay Hill Ln #104 Fishers, IN 46037
Estimated Value: $329,000 - $366,893
3
Beds
3
Baths
2,735
Sq Ft
$130/Sq Ft
Est. Value
About This Home
This home is located at 11455 Clay Hill Ln #104, Fishers, IN 46037 and is currently estimated at $354,973, approximately $129 per square foot. 11455 Clay Hill Ln #104 is a home located in Hamilton County with nearby schools including Bryant Elementary School, Fishers Elementary School, and Riverside Junior High School.
Ownership History
Date
Name
Owned For
Owner Type
Purchase Details
Closed on
Sep 28, 2018
Sold by
Thomas Sheila
Bought by
Fruehman Leslie
Current Estimated Value
Home Financials for this Owner
Home Financials are based on the most recent Mortgage that was taken out on this home.
Original Mortgage
$188,700
Outstanding Balance
$164,558
Interest Rate
4.5%
Mortgage Type
New Conventional
Estimated Equity
$190,415
Purchase Details
Closed on
May 10, 2017
Sold by
Wietecha Timothy T and Wietecha Debra A
Bought by
Thomas Sheila
Home Financials for this Owner
Home Financials are based on the most recent Mortgage that was taken out on this home.
Original Mortgage
$186,300
Interest Rate
6.75%
Mortgage Type
Adjustable Rate Mortgage/ARM
Purchase Details
Closed on
Oct 31, 2012
Sold by
Freedman Jack M
Bought by
Huffman Daniel A
Create a Home Valuation Report for This Property
The Home Valuation Report is an in-depth analysis detailing your home's value as well as a comparison with similar homes in the area
Home Values in the Area
Average Home Value in this Area
Purchase History
| Date | Buyer | Sale Price | Title Company |
|---|---|---|---|
| Fruehman Leslie | -- | None Available | |
| Thomas Sheila | -- | None Available | |
| Huffman Daniel A | -- | None Available |
Source: Public Records
Mortgage History
| Date | Status | Borrower | Loan Amount |
|---|---|---|---|
| Open | Fruehman Leslie | $188,700 | |
| Previous Owner | Thomas Sheila | $186,300 |
Source: Public Records
Tax History Compared to Growth
Tax History
| Year | Tax Paid | Tax Assessment Tax Assessment Total Assessment is a certain percentage of the fair market value that is determined by local assessors to be the total taxable value of land and additions on the property. | Land | Improvement |
|---|---|---|---|---|
| 2024 | $2,997 | $291,700 | $77,000 | $214,700 |
| 2023 | $2,997 | $274,900 | $60,900 | $214,000 |
| 2022 | $2,437 | $262,500 | $60,900 | $201,600 |
| 2021 | $2,437 | $213,400 | $46,500 | $166,900 |
| 2020 | $2,337 | $202,800 | $46,500 | $156,300 |
| 2019 | $2,062 | $183,800 | $41,300 | $142,500 |
| 2018 | $2,085 | $185,500 | $41,300 | $144,200 |
| 2017 | $2,152 | $191,300 | $41,300 | $150,000 |
| 2016 | $2,190 | $194,700 | $41,300 | $153,400 |
| 2014 | $1,894 | $185,100 | $49,100 | $136,000 |
| 2013 | $1,894 | $186,600 | $49,100 | $137,500 |
Source: Public Records
Map
Nearby Homes
- 11359 Cumberland Rd
- 11474 Clay Ct Unit 102
- 11475 Clay Ct Unit 103
- 11436 Mossy Ct Unit 101
- 11504 Grassy Ct Unit 103
- 11412 Niagara Dr
- 11388 Falling Water Way
- 11262 Whitewater Way
- 10019 Niagara Dr
- 9237 Crossing Dr
- 11310 Knightsbridge Ln
- 10263 Brixton Ln
- 10747 Red Pine Dr
- 9259 Oak Knoll Ln
- 11226 Reflection Point Dr
- 10655 Eric Ct
- 10661 Burning Ridge Ln
- 11287 Reflection Point Dr
- 10563 Brixton Ln
- 8778 Morgan Dr
- 11455 Clayhill Ln Unit 100
- 11455 Clay Hill #105 Ln Unit 6-A
- 11455 Clayhill Ln
- 11455 Clay Hill Ln
- 11455 Clay Hill Ln Unit 100
- 11455 Clay Hill Ln Unit 101
- 11455 Clay Hill Ln Unit 103
- 11455 Clay Hill Ln Unit 104
- 11455 Clay Hill Ln Unit 105
- 11455 Clay Hill Ln
- 12516 Clover Ct
- 9756 Clover Ct #100 Unit 100
- 9756 Clover Ct #103
- 9800 Thorne Cliff Way
- 9800 Thorne Cliff Way Unit 100
- 11475 Clay Ct Unit 106
- 11475 Clay Ct Unit 105
- 11475 Clay Ct Unit 104
- 11475 Clay Ct Unit 103