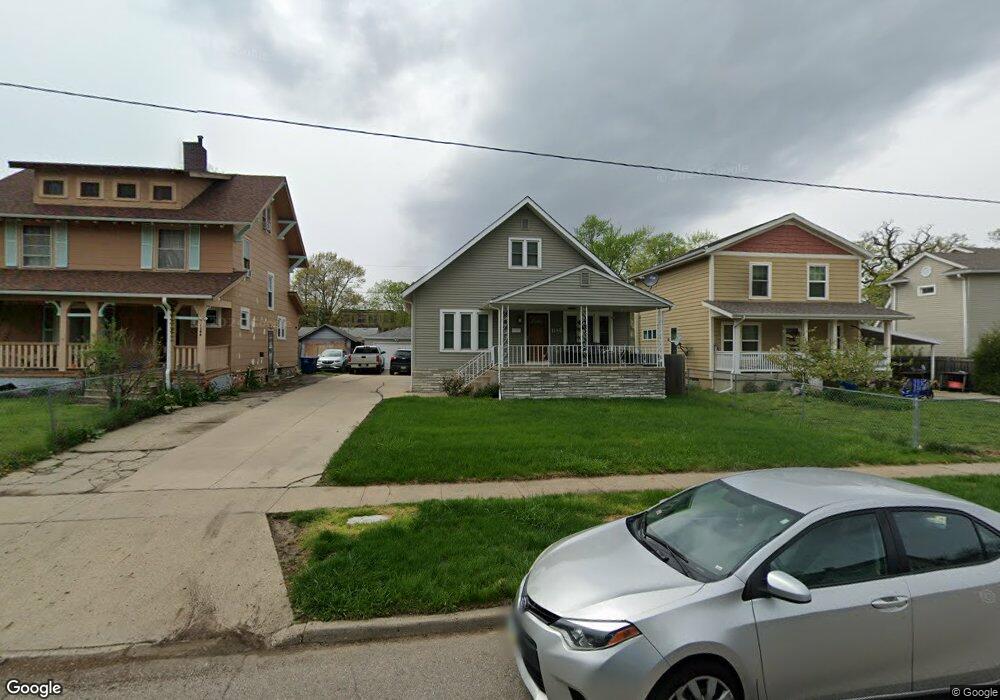
1146 18th St Des Moines, IA 50314
Cheatom Park NeighborhoodEstimated Value: $138,000 - $160,000
4
Beds
1
Bath
1,404
Sq Ft
$107/Sq Ft
Est. Value
About This Home
This home is located at 1146 18th St, Des Moines, IA 50314 and is currently estimated at $150,418, approximately $107 per square foot. 1146 18th St is a home located in Polk County with nearby schools including Callanan Middle School and Roosevelt High School.
Ownership History
Date
Name
Owned For
Owner Type
Purchase Details
Closed on
Dec 2, 2002
Sold by
Ira Janice E Delaney
Bought by
Morales Geraldo
Current Estimated Value
Purchase Details
Closed on
May 22, 2002
Sold by
Contract Exchange Corp
Bought by
Ira Janice E Delaney
Purchase Details
Closed on
May 2, 2002
Sold by
American Trust & Svgs Bank
Bought by
Contract Exchange Corp
Purchase Details
Closed on
Aug 30, 1999
Sold by
Wade Stephen C and Pence Susan M
Bought by
Delaney & Kelly Construction Co 401 K Pr
Create a Home Valuation Report for This Property
The Home Valuation Report is an in-depth analysis detailing your home's value as well as a comparison with similar homes in the area
Home Values in the Area
Average Home Value in this Area
Purchase History
| Date | Buyer | Sale Price | Title Company |
|---|---|---|---|
| Morales Geraldo | $49,500 | -- | |
| Ira Janice E Delaney | -- | -- | |
| Contract Exchange Corp | -- | -- | |
| Delaney & Kelly Construction Co 401 K Pr | -- | -- |
Source: Public Records
Tax History Compared to Growth
Tax History
| Year | Tax Paid | Tax Assessment Tax Assessment Total Assessment is a certain percentage of the fair market value that is determined by local assessors to be the total taxable value of land and additions on the property. | Land | Improvement |
|---|---|---|---|---|
| 2025 | $2,150 | $126,900 | $13,400 | $113,500 |
| 2024 | $2,150 | $109,300 | $11,400 | $97,900 |
| 2023 | $1,824 | $109,300 | $11,400 | $97,900 |
| 2022 | $1,810 | $77,400 | $8,700 | $68,700 |
| 2021 | $1,702 | $77,400 | $8,700 | $68,700 |
| 2020 | $1,768 | $68,200 | $7,700 | $60,500 |
| 2019 | $1,664 | $68,200 | $7,700 | $60,500 |
| 2018 | $1,646 | $61,900 | $6,900 | $55,000 |
| 2017 | $1,682 | $61,900 | $6,900 | $55,000 |
| 2016 | $1,640 | $62,200 | $6,900 | $55,300 |
| 2015 | $1,640 | $62,200 | $6,900 | $55,300 |
| 2014 | $1,536 | $60,000 | $7,300 | $52,700 |
Source: Public Records
Map
Nearby Homes
- 1159 18th St
- 1107 18th St
- 1103 18th St
- 1175 21st St
- 2126 University Ave
- 2210 University Ave
- 1070 22nd St
- 1303 22nd St
- 930 18th St
- 1054 14th St
- 0000 Keosauqua Way
- 920 18th St
- 1120 23rd St Unit 6
- 2305 Drake Park Ave
- 2303 Carpenter Ave
- 1107 24th St
- 1503 Forest Ave
- 1318 23rd St
- 1429 Martin Luther King jr Pkwy
- 1514 Harrison Ave