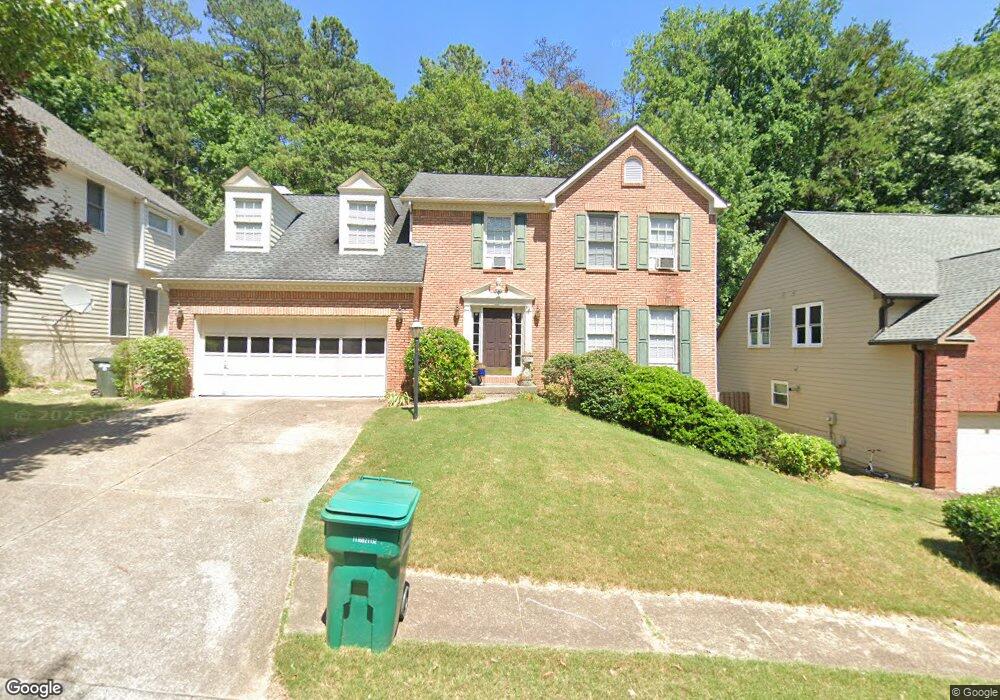
1146 Manor Crest Ct NE Marietta, GA 30068
East Cobb NeighborhoodEstimated Value: $545,177 - $619,000
3
Beds
3
Baths
2,152
Sq Ft
$267/Sq Ft
Est. Value
About This Home
This home is located at 1146 Manor Crest Ct NE, Marietta, GA 30068 and is currently estimated at $575,044, approximately $267 per square foot. 1146 Manor Crest Ct NE is a home located in Cobb County with nearby schools including East Side Elementary School, Dodgen Middle School, and Walton High School.
Ownership History
Date
Name
Owned For
Owner Type
Purchase Details
Closed on
Aug 18, 2011
Sold by
Freeport Title & Guaranty
Bought by
Robbins Ian
Current Estimated Value
Purchase Details
Closed on
Apr 4, 2000
Sold by
Robbins Ian
Bought by
Robbins Ian and Robbins Roni
Home Financials for this Owner
Home Financials are based on the most recent Mortgage that was taken out on this home.
Original Mortgage
$127,000
Interest Rate
8.29%
Mortgage Type
New Conventional
Purchase Details
Closed on
Feb 29, 2000
Sold by
Oconnor Nocole M and Oconnor Michael J
Bought by
Robbins Lan
Home Financials for this Owner
Home Financials are based on the most recent Mortgage that was taken out on this home.
Original Mortgage
$127,000
Interest Rate
8.29%
Mortgage Type
New Conventional
Purchase Details
Closed on
Jan 19, 1994
Sold by
Ryland Group Inc The
Bought by
Oconnor Nicole M Michael J
Home Financials for this Owner
Home Financials are based on the most recent Mortgage that was taken out on this home.
Original Mortgage
$166,200
Interest Rate
7.1%
Create a Home Valuation Report for This Property
The Home Valuation Report is an in-depth analysis detailing your home's value as well as a comparison with similar homes in the area
Home Values in the Area
Average Home Value in this Area
Purchase History
| Date | Buyer | Sale Price | Title Company |
|---|---|---|---|
| Robbins Ian | -- | -- | |
| Robbins Ian | -- | -- | |
| Robbins Lan | $253,000 | -- | |
| Oconnor Nicole M Michael J | $175,000 | -- |
Source: Public Records
Mortgage History
| Date | Status | Borrower | Loan Amount |
|---|---|---|---|
| Previous Owner | Robbins Lan | $127,000 | |
| Previous Owner | Oconnor Nicole M Michael J | $166,200 |
Source: Public Records
Tax History Compared to Growth
Tax History
| Year | Tax Paid | Tax Assessment Tax Assessment Total Assessment is a certain percentage of the fair market value that is determined by local assessors to be the total taxable value of land and additions on the property. | Land | Improvement |
|---|---|---|---|---|
| 2025 | $1,600 | $205,116 | $50,000 | $155,116 |
| 2024 | $5,253 | $205,116 | $50,000 | $155,116 |
| 2023 | $3,776 | $162,024 | $32,000 | $130,024 |
| 2022 | $4,349 | $162,024 | $32,000 | $130,024 |
| 2021 | $4,349 | $162,024 | $32,000 | $130,024 |
| 2020 | $4,255 | $157,728 | $32,000 | $125,728 |
| 2019 | $4,255 | $157,728 | $32,000 | $125,728 |
| 2018 | $3,802 | $137,060 | $32,000 | $105,060 |
| 2017 | $3,617 | $137,060 | $32,000 | $105,060 |
| 2016 | $3,765 | $143,660 | $32,000 | $111,660 |
| 2015 | $3,157 | $116,012 | $32,000 | $84,012 |
| 2014 | $3,184 | $116,012 | $0 | $0 |
Source: Public Records
Map
Nearby Homes
- 1200 Mitsy Forest Dr NE
- 0 Old Canton Rd NE Unit 10567243
- 0 Old Canton Rd NE Unit 7617214
- 3570 Brighton Place
- 1120 Taliwa Trail NE
- 1257 Independence Way
- 2994 Octavia Cir
- 860 Mitsy Ridge Dr
- 3506 Clubland Dr Unit 6
- 3542 Clubland Dr
- 2880 Octavia Cir
- 2868 Octavia Cir
- 3442 Fox Hollow Dr
- 640 Maddie Way
- 3769 High Green Dr
- 3792 Raccoon Run
- 925 Sunny Meadows Ln
- 3760 Creekstone Way
- 909 Sunny Meadows Ln
- 1152 Manor Crest Ct NE
- 1140 Manor Crest Ct NE
- 1158 Manor Crest Ct NE
- 1151 Manor Crest Ct NE
- 1134 Manor Crest Ct NE
- 1157 Manor Crest Ct NE
- 1164 Manor Crest Ct NE
- 1141 Manor Crest Ct NE
- 1163 Manor Crest Ct NE
- 1170 Manor Crest Ct NE
- 1169 Manor Crest Ct NE
- 1120 Mitsy Forest Dr NE
- 1110 Mitsy Forest Dr NE
- 1130 Mitsy Forest Dr NE
- 1100 Mitsy Forest Dr NE
- 1175 Manor Crest Ct NE
- 1176 Manor Crest Ct NE
- 1140 Mitsy Forest Dr NE
- 1090 Mitsy Forest Dr NE
- 1181 Manor Crest Ct NE