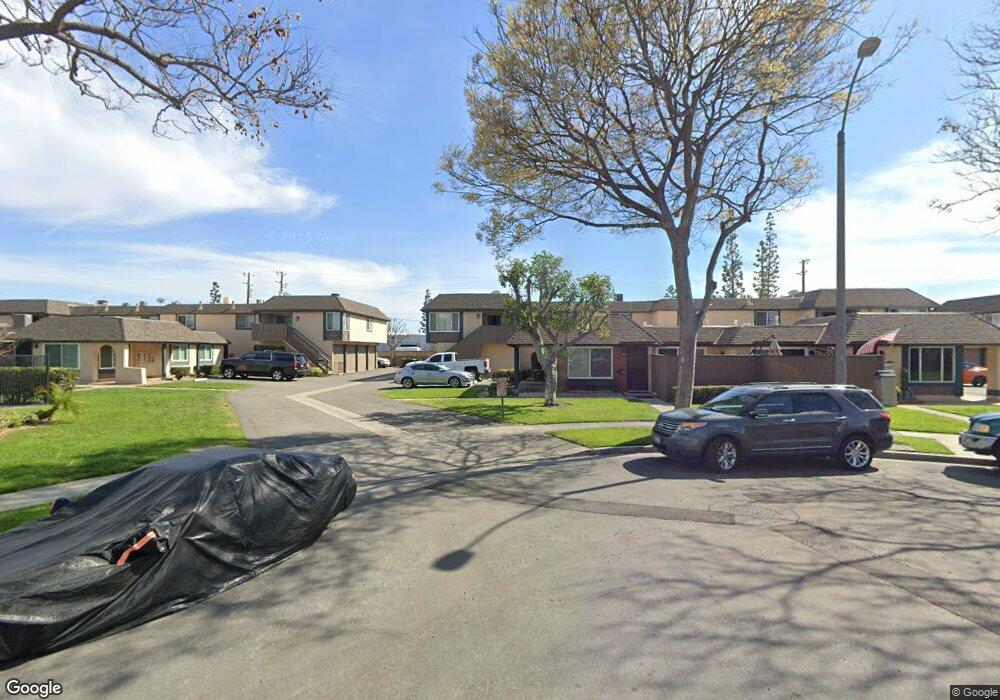
1146 S Dover Cir Anaheim, CA 92805
Southeast Anaheim NeighborhoodEstimated Value: $614,011 - $630,000
3
Beds
2
Baths
1,112
Sq Ft
$561/Sq Ft
Est. Value
About This Home
This home is located at 1146 S Dover Cir, Anaheim, CA 92805 and is currently estimated at $623,753, approximately $560 per square foot. 1146 S Dover Cir is a home located in Orange County with nearby schools including Theodore Roosevelt Elementary School, South Junior High School, and Katella High School.
Ownership History
Date
Name
Owned For
Owner Type
Purchase Details
Closed on
Mar 14, 2023
Sold by
Lemus Lucha
Bought by
Lemus Lucha and Lemus Ulysses
Current Estimated Value
Purchase Details
Closed on
Feb 16, 2005
Sold by
Rojo Cesar and Rojo Alina
Bought by
Lemus Lucha
Purchase Details
Closed on
Jun 6, 2001
Sold by
Bridges Lari N
Bought by
Rojo Cesar and Rojo Alina
Home Financials for this Owner
Home Financials are based on the most recent Mortgage that was taken out on this home.
Original Mortgage
$174,850
Interest Rate
6.87%
Mortgage Type
FHA
Purchase Details
Closed on
Jun 10, 1999
Sold by
Bridges Michael
Bought by
Bridges Lari N
Home Financials for this Owner
Home Financials are based on the most recent Mortgage that was taken out on this home.
Original Mortgage
$131,920
Interest Rate
7.2%
Mortgage Type
FHA
Create a Home Valuation Report for This Property
The Home Valuation Report is an in-depth analysis detailing your home's value as well as a comparison with similar homes in the area
Home Values in the Area
Average Home Value in this Area
Purchase History
| Date | Buyer | Sale Price | Title Company |
|---|---|---|---|
| Lemus Lucha | -- | None Listed On Document | |
| Lemus Lucha | $362,500 | Stewart Title | |
| Rojo Cesar | $185,000 | North American Title Co | |
| Bridges Lari N | -- | Fidelity National Title Co | |
| Bridges Lari N | $136,000 | Fidelity National Title Co |
Source: Public Records
Mortgage History
| Date | Status | Borrower | Loan Amount |
|---|---|---|---|
| Previous Owner | Rojo Cesar | $174,850 | |
| Previous Owner | Bridges Lari N | $131,920 |
Source: Public Records
Tax History Compared to Growth
Tax History
| Year | Tax Paid | Tax Assessment Tax Assessment Total Assessment is a certain percentage of the fair market value that is determined by local assessors to be the total taxable value of land and additions on the property. | Land | Improvement |
|---|---|---|---|---|
| 2025 | $5,830 | $505,283 | $406,259 | $99,024 |
| 2024 | $5,830 | $495,376 | $398,293 | $97,083 |
| 2023 | $5,708 | $485,663 | $390,483 | $95,180 |
| 2022 | $5,300 | $445,740 | $370,344 | $75,396 |
| 2021 | $5,310 | $437,000 | $363,082 | $73,918 |
| 2020 | $4,986 | $406,000 | $332,082 | $73,918 |
| 2019 | $4,927 | $406,000 | $332,082 | $73,918 |
| 2018 | $4,915 | $406,000 | $332,082 | $73,918 |
| 2017 | $4,084 | $340,000 | $266,082 | $73,918 |
| 2016 | $4,147 | $340,000 | $266,082 | $73,918 |
| 2015 | $3,449 | $276,247 | $202,329 | $73,918 |
| 2014 | $3,299 | $276,247 | $202,329 | $73,918 |
Source: Public Records
Map
Nearby Homes
- 1101 S Clifpark Cir
- 2144 E Almont Ave
- 617 E Eton Place
- 611 E Eton Place
- 1415 E South St
- 1615 E South St
- 725 S Mosaic St
- 1206 W Cara Dr
- 1539 W Cara Dr
- 1638 S Urbana St
- 1422 S Urbana St
- 760 S Olive St
- 1403 W Bushell St
- 1522 S Urbana St
- 1407 W Bushell St
- 1400 S Sunkist St Unit 214
- 1400 S Sunkist St Unit 82
- 1400 S Sunkist St Unit 173
- 1400 S Sunkist St Unit 170
- 1400 S Sunkist St Unit 80
- 1144 S Dover Cir
- 1142 S Dover Cir Unit Q60
- 1142 S Dover Cir Unit 60Q
- 1142 S Dover Cir Unit Q
- 1262 E Bell Ave Unit 91
- 1264 E Bell Ave Unit 92
- 1140 S Dover Cir
- 1266 E Bell Ave Unit 93
- 1268 E Bell Ave Unit 940
- 1155 S Dover Cir Unit 57N
- 1272 E Bell Ave
- 1153 S Dover Cir Unit 56m
- 1153 S Dover Cir
- 1274 E Bell Ave Unit 97R
- 1274 E Bell Ave
- 1204 E Bell Ave Unit 1A
- 1260 E Bell Ave Unit 90K
- 1151 S Dover Cir Unit 55
- 1258 E Bell Ave Unit 69
- 1149 S Dover Cir Unit 54