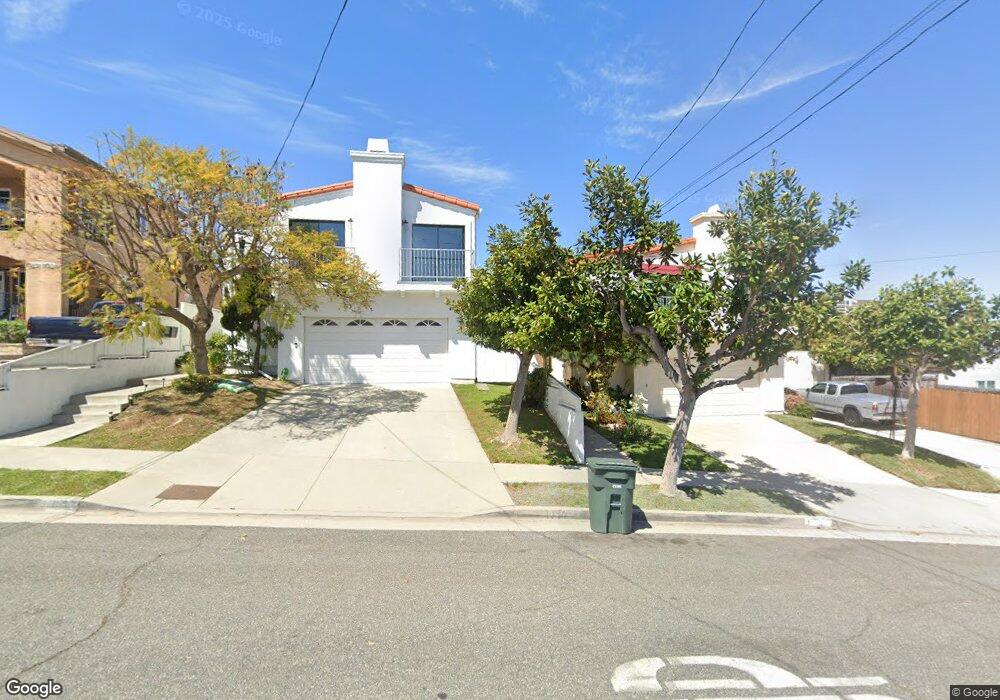
1146 W 2nd St Unit 2 San Pedro, CA 90731
Estimated Value: $652,641 - $896,000
3
Beds
3
Baths
1,558
Sq Ft
$474/Sq Ft
Est. Value
About This Home
This home is located at 1146 W 2nd St Unit 2, San Pedro, CA 90731 and is currently estimated at $739,160, approximately $474 per square foot. 1146 W 2nd St Unit 2 is a home located in Los Angeles County with nearby schools including Bandini Street Elementary School, Dana Middle School, and San Pedro Senior High School.
Ownership History
Date
Name
Owned For
Owner Type
Purchase Details
Closed on
Dec 29, 2025
Sold by
Bender Richard and Bender Rick
Bought by
Bender Richard
Current Estimated Value
Home Financials for this Owner
Home Financials are based on the most recent Mortgage that was taken out on this home.
Original Mortgage
$19,829
Outstanding Balance
$19,810
Interest Rate
6.24%
Mortgage Type
New Conventional
Estimated Equity
$719,350
Purchase Details
Closed on
Jun 6, 2016
Sold by
Boyd Christopher H
Bought by
Bender Rick
Home Financials for this Owner
Home Financials are based on the most recent Mortgage that was taken out on this home.
Original Mortgage
$550,000
Interest Rate
3.71%
Mortgage Type
Purchase Money Mortgage
Purchase Details
Closed on
Oct 29, 2015
Sold by
Samotin Sheri L
Bought by
Boyd Christopher H
Purchase Details
Closed on
Oct 27, 2009
Sold by
Boyd Norman Herriman
Bought by
Boyd Norman H and Norman H Boyd Revocable Trust
Purchase Details
Closed on
Oct 28, 1993
Sold by
Noah John Robert and Noah Mary C
Bought by
Boyd Norman Herriman
Home Financials for this Owner
Home Financials are based on the most recent Mortgage that was taken out on this home.
Original Mortgage
$140,000
Interest Rate
6.97%
Create a Home Valuation Report for This Property
The Home Valuation Report is an in-depth analysis detailing your home's value as well as a comparison with similar homes in the area
Home Values in the Area
Average Home Value in this Area
Purchase History
| Date | Buyer | Sale Price | Title Company |
|---|---|---|---|
| Bender Richard | -- | Fidelity National Title | |
| Bender Rick | $350,000 | Fidelity National Title Co | |
| Boyd Christopher H | -- | None Available | |
| Boyd Norman H | -- | None Available | |
| Boyd Norman Herriman | $175,000 | First American Title Co |
Source: Public Records
Mortgage History
| Date | Status | Borrower | Loan Amount |
|---|---|---|---|
| Open | Bender Richard | $19,829 | |
| Previous Owner | Bender Rick | $550,000 | |
| Previous Owner | Boyd Norman Herriman | $140,000 |
Source: Public Records
Tax History
| Year | Tax Paid | Tax Assessment Tax Assessment Total Assessment is a certain percentage of the fair market value that is determined by local assessors to be the total taxable value of land and additions on the property. | Land | Improvement |
|---|---|---|---|---|
| 2025 | $6,000 | $479,429 | $189,404 | $290,025 |
| 2024 | $6,000 | $470,030 | $185,691 | $284,339 |
| 2023 | $5,895 | $460,814 | $182,050 | $278,764 |
| 2022 | $5,606 | $451,780 | $178,481 | $273,299 |
| 2021 | $5,539 | $442,923 | $174,982 | $267,941 |
| 2019 | $5,362 | $429,788 | $169,793 | $259,995 |
| 2018 | $5,289 | $421,362 | $166,464 | $254,898 |
| 2016 | $5,103 | $409,034 | $222,639 | $186,395 |
| 2015 | $3,125 | $247,475 | $98,990 | $148,485 |
| 2014 | $3,128 | $242,628 | $97,051 | $145,577 |
Source: Public Records
Map
Nearby Homes
- 153 N Hanford Ave
- 1274 W 3rd St
- 510 Bellmarin Dr
- 514 Arcadia Dr
- 875 W 1st St
- 944 W Sepulveda St
- 981 W Oliver St
- 1403 W Santa Cruz St
- 1176 W 7th St Unit 4
- 529 N Leland Ave
- 719 Oro Terrace
- 884 W Sepulveda St
- 927 W 6th St
- 834 W Santa Cruz St
- 784 W 1st St
- 876 W Oliver St
- 221 N Harbor View Ave
- 739 W 2nd St
- 1110 W 10th St Unit 105
- 1136 W 10th St
- 1142 W 2nd St Unit 3
- 1148 W 2nd St
- 1140 W 2nd St
- 1150 W 2nd St
- 123 S La Alameda Ave
- 125 S La Alameda Ave
- 125 S La Alameda Ave Unit A
- 125 S La Alameda Ave Unit B
- 139 S La Alameda Ave
- 1160 W 2nd St
- 1160 W 2nd St
- 109 S La Alameda Ave
- 141 S La Alameda Ave
- 1127 W 1st St
- 142 S Hanford Ave
- 1151 W 2nd St
- 105 S La Alameda Ave
- 1153 W 2nd St Unit 1157
- 1153 W 2nd St
- 1133 W 1st St
Your Personal Tour Guide
Ask me questions while you tour the home.