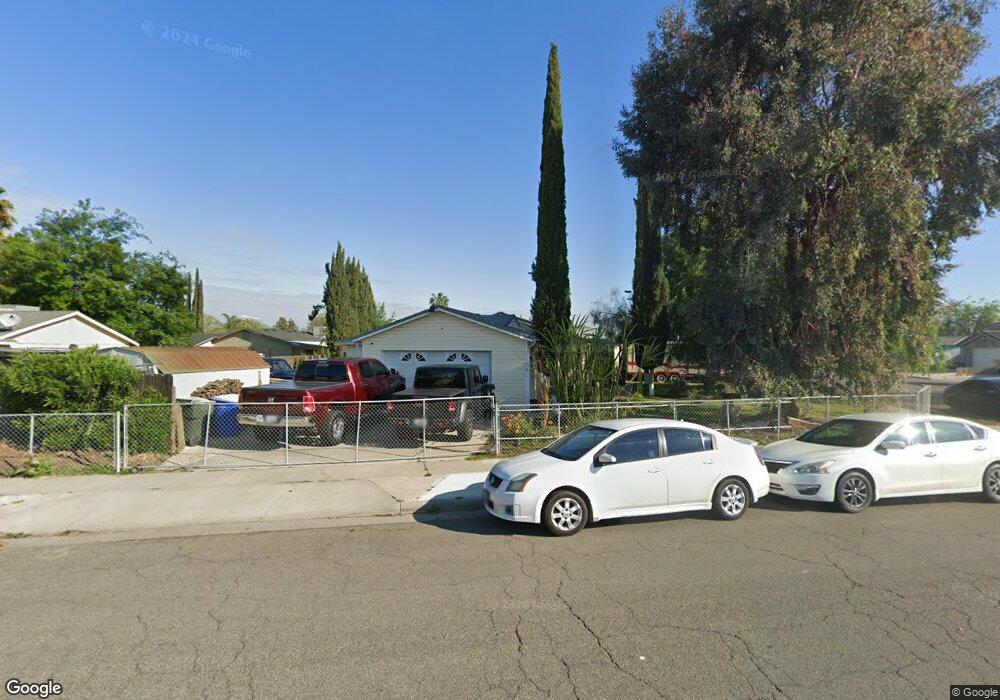
1146 Wren Dr Hanford, CA 93230
Estimated Value: $316,000 - $339,000
3
Beds
2
Baths
1,478
Sq Ft
$220/Sq Ft
Est. Value
About This Home
This home is located at 1146 Wren Dr, Hanford, CA 93230 and is currently estimated at $325,568, approximately $220 per square foot. 1146 Wren Dr is a home located in Kings County with nearby schools including Roosevelt Elementary School, Woodrow Wilson Junior High School, and Hanford West High School.
Ownership History
Date
Name
Owned For
Owner Type
Purchase Details
Closed on
Mar 9, 2013
Sold by
Gomez Dinora Isabel and Gomez Dinora
Bought by
Gomez Dinora Isabel and Gonzalez Francisco Lopez
Current Estimated Value
Home Financials for this Owner
Home Financials are based on the most recent Mortgage that was taken out on this home.
Original Mortgage
$168,700
Outstanding Balance
$77,469
Interest Rate
3.53%
Mortgage Type
New Conventional
Estimated Equity
$248,099
Purchase Details
Closed on
Apr 25, 2007
Sold by
Gomez Dinora
Bought by
Gomez Dinora
Purchase Details
Closed on
Feb 11, 2004
Sold by
Contreras Carlos
Bought by
Gomez Dinora
Home Financials for this Owner
Home Financials are based on the most recent Mortgage that was taken out on this home.
Original Mortgage
$79,000
Interest Rate
5.85%
Mortgage Type
New Conventional
Purchase Details
Closed on
May 29, 2001
Sold by
Viehbeck Ralph E and Viehbeck Yvonne M
Bought by
Contreras Carlos and Gomez Dinora
Home Financials for this Owner
Home Financials are based on the most recent Mortgage that was taken out on this home.
Original Mortgage
$78,662
Interest Rate
7.21%
Mortgage Type
FHA
Create a Home Valuation Report for This Property
The Home Valuation Report is an in-depth analysis detailing your home's value as well as a comparison with similar homes in the area
Home Values in the Area
Average Home Value in this Area
Purchase History
| Date | Buyer | Sale Price | Title Company |
|---|---|---|---|
| Gomez Dinora Isabel | -- | None Available | |
| Gomez Dinora | -- | None Available | |
| Gomez Dinora | -- | Chicago Title Company | |
| Contreras Carlos | $95,000 | Cuesta Title Company |
Source: Public Records
Mortgage History
| Date | Status | Borrower | Loan Amount |
|---|---|---|---|
| Open | Gomez Dinora Isabel | $168,700 | |
| Closed | Gomez Dinora | $79,000 | |
| Previous Owner | Contreras Carlos | $78,662 | |
| Closed | Contreras Carlos | $19,910 |
Source: Public Records
Tax History Compared to Growth
Tax History
| Year | Tax Paid | Tax Assessment Tax Assessment Total Assessment is a certain percentage of the fair market value that is determined by local assessors to be the total taxable value of land and additions on the property. | Land | Improvement |
|---|---|---|---|---|
| 2025 | $1,414 | $140,342 | $32,499 | $107,843 |
| 2023 | $1,414 | $134,894 | $31,238 | $103,656 |
| 2022 | $1,381 | $132,250 | $30,626 | $101,624 |
| 2021 | $1,350 | $129,658 | $30,026 | $99,632 |
| 2020 | $1,363 | $128,328 | $29,718 | $98,610 |
| 2019 | $1,339 | $125,811 | $29,135 | $96,676 |
| 2018 | $1,299 | $123,344 | $28,564 | $94,780 |
| 2017 | $1,278 | $120,926 | $28,004 | $92,922 |
| 2016 | $1,260 | $118,555 | $27,455 | $91,100 |
| 2015 | $1,251 | $116,775 | $27,043 | $89,732 |
| 2014 | $1,225 | $114,487 | $26,513 | $87,974 |
Source: Public Records
Map
Nearby Homes
- 1292 S Monterey Ave
- 1292 Monterey Ave
- 1575 Bluejay Cir
- 1405 Arthur St
- 1426 W Sidonia St
- 1526 W Bison Ln Unit Ae 86
- 1765 Parkside Dr
- 1638 Acres Way
- 1240 Washington St
- 1754 W Twilight St
- Orchid Plan at Live Oak
- Marigold Plan at Live Oak
- Abernathy Plan at Live Oak
- 1452 S Polar Ave
- Beaumont Plan at Live Oak
- Clover Plan at Live Oak
- 735 Manor Ave
- 1842 W Twilight St
- Lot 128 1502 S Autumn Breeze Rd
- 1577 S Barberry Place Unit Ho53