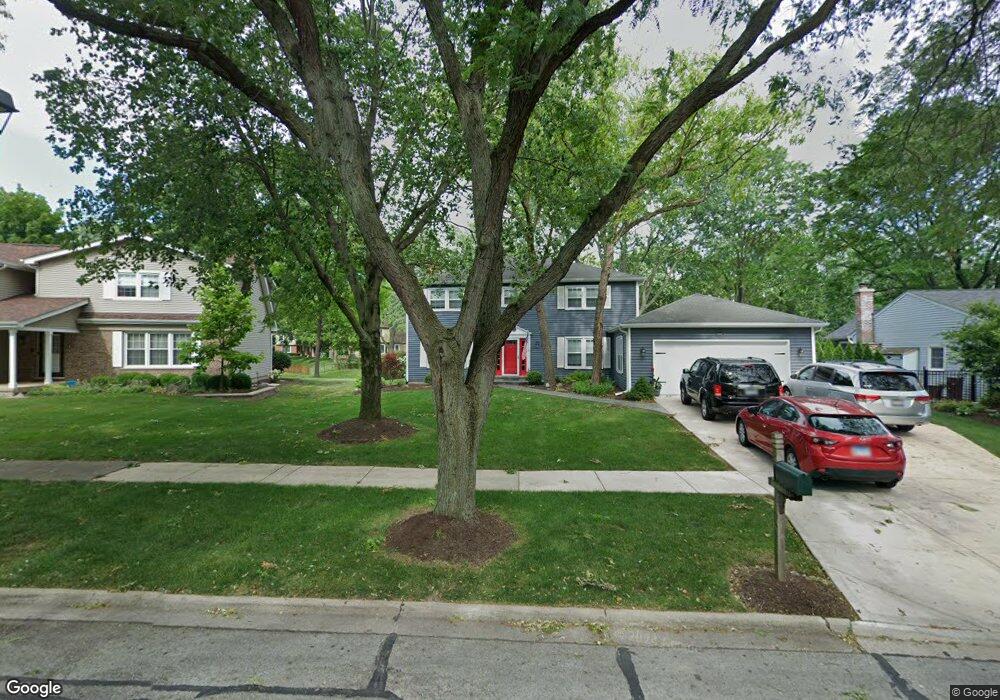
1146 Wydown Ct Naperville, IL 60540
Huntington Hill NeighborhoodEstimated Value: $628,000 - $716,884
5
Beds
3
Baths
2,725
Sq Ft
$251/Sq Ft
Est. Value
About This Home
This home is located at 1146 Wydown Ct, Naperville, IL 60540 and is currently estimated at $684,721, approximately $251 per square foot. 1146 Wydown Ct is a home located in DuPage County with nearby schools including Highlands Elementary School, Kennedy Junior High School, and Naperville North High School.
Ownership History
Date
Name
Owned For
Owner Type
Purchase Details
Closed on
Jul 27, 2007
Sold by
Andersen Scott R and Andersen Gloria S
Bought by
Temple Gregory A and Temple Shelly L
Current Estimated Value
Home Financials for this Owner
Home Financials are based on the most recent Mortgage that was taken out on this home.
Original Mortgage
$344,000
Outstanding Balance
$219,025
Interest Rate
6.77%
Mortgage Type
Purchase Money Mortgage
Estimated Equity
$465,696
Purchase Details
Closed on
Jun 21, 1995
Sold by
White John R and White Linda R
Bought by
Andersen Scott R and Andersen Gloria S
Home Financials for this Owner
Home Financials are based on the most recent Mortgage that was taken out on this home.
Original Mortgage
$136,000
Interest Rate
7.88%
Purchase Details
Closed on
Nov 22, 1994
Sold by
White John R and White Linda R
Bought by
White John R and White Linda R
Create a Home Valuation Report for This Property
The Home Valuation Report is an in-depth analysis detailing your home's value as well as a comparison with similar homes in the area
Home Values in the Area
Average Home Value in this Area
Purchase History
| Date | Buyer | Sale Price | Title Company |
|---|---|---|---|
| Temple Gregory A | $430,000 | Ticor Title | |
| Andersen Scott R | $214,000 | First American Title | |
| White John R | -- | -- |
Source: Public Records
Mortgage History
| Date | Status | Borrower | Loan Amount |
|---|---|---|---|
| Open | Temple Gregory A | $344,000 | |
| Previous Owner | Andersen Scott R | $136,000 |
Source: Public Records
Tax History
| Year | Tax Paid | Tax Assessment Tax Assessment Total Assessment is a certain percentage of the fair market value that is determined by local assessors to be the total taxable value of land and additions on the property. | Land | Improvement |
|---|---|---|---|---|
| 2024 | $11,387 | $193,884 | $85,563 | $108,321 |
| 2023 | $10,955 | $176,950 | $78,090 | $98,860 |
| 2022 | $10,193 | $163,850 | $72,310 | $91,540 |
| 2021 | $9,822 | $157,660 | $69,580 | $88,080 |
| 2020 | $9,614 | $154,500 | $68,330 | $86,170 |
| 2019 | $9,334 | $147,810 | $65,370 | $82,440 |
| 2018 | $9,054 | $143,510 | $63,470 | $80,040 |
| 2017 | $8,872 | $138,670 | $61,330 | $77,340 |
| 2016 | $8,695 | $133,650 | $59,110 | $74,540 |
| 2015 | $8,639 | $125,850 | $55,660 | $70,190 |
| 2014 | $8,737 | $123,380 | $54,570 | $68,810 |
| 2013 | $8,606 | $123,680 | $54,700 | $68,980 |
Source: Public Records
Map
Nearby Homes
- 1105 Johnson Dr
- 1204 Hobson Oaks Ct Unit 1204
- 1172 Kenilworth Cir
- 1010 Revere Ct
- 1285 Stonebriar Ct
- 907 Secretariat Dr
- 1386 Old Dominion Ct
- 8S452 Bell Dr
- 923 Tim Tam Cir
- 1509 Shiva Ln
- 311 Millcreek Ln
- 1449 Whitespire Ct Unit 5104
- 2450 Tanglewood Dr
- 510 Harlowe Ln Unit 2001C
- 1546 Treeline Ct Unit 405
- 1255 E Bailey Rd
- 1583 Orchard Cir
- 1405 E Bailey Rd
- 538 Harlowe Ln Unit 1801
- 908 Julian Ct
- 1144 Wydown Ct
- 1148 Wydown Ct
- 1140 Wydown Ct Unit 1
- 1143 Overton Ct
- 1147 Overton Ct
- 1152 Wydown Ct
- 1136 S Naper Blvd Unit 1
- 1156 Wydown Ct
- 1127 Overton Ct
- 1155 Wydown Ct
- 1153 Overton Ct
- 1151 Wydown Ct
- 1136 Huntleigh Dr
- 1150 Overton Ct
- 1146 Overton Ct
- 1138 Overton Ct
- 1142 Overton Ct
- 1133 Huntleigh Dr
- 1125 S Naper Blvd
- 1134 Overton Ct
Your Personal Tour Guide
Ask me questions while you tour the home.