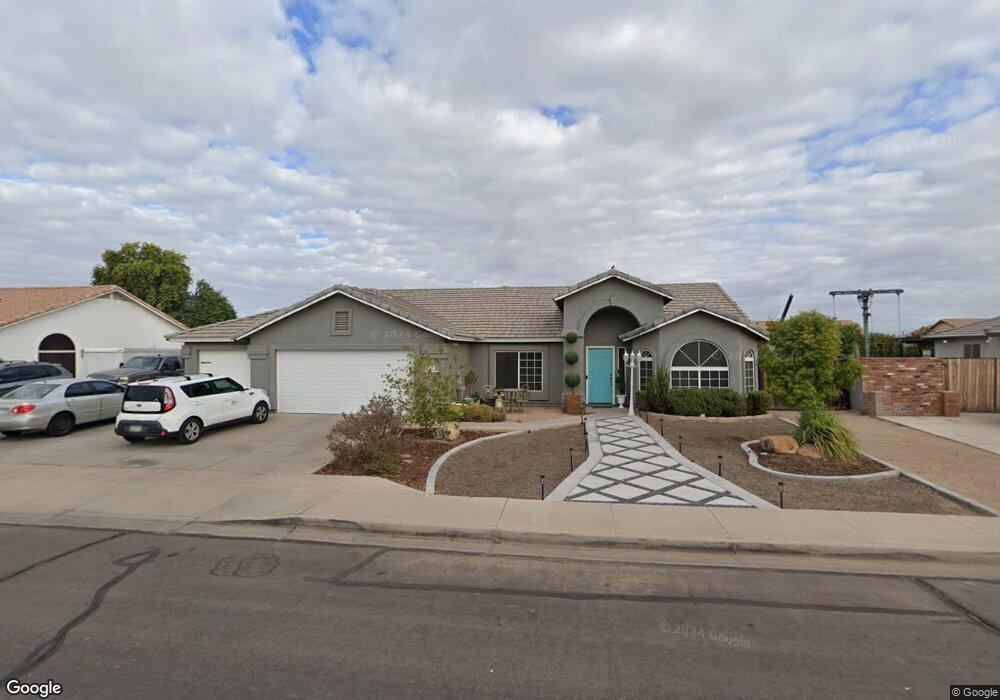
11462 E Rutledge Ave Mesa, AZ 85212
Superstition Vistas NeighborhoodEstimated Value: $516,000 - $562,000
--
Bed
3
Baths
2,008
Sq Ft
$269/Sq Ft
Est. Value
About This Home
This home is located at 11462 E Rutledge Ave, Mesa, AZ 85212 and is currently estimated at $539,191, approximately $268 per square foot. 11462 E Rutledge Ave is a home located in Maricopa County with nearby schools including Desert Ridge Jr. High School, Desert Ridge High School, and Ala Mesa.
Ownership History
Date
Name
Owned For
Owner Type
Purchase Details
Closed on
May 24, 2013
Sold by
Babbitt Lorenzo and Babbitt Karie D
Bought by
Babbitt Lorenzo S and Spackman Babbitt Karie S
Current Estimated Value
Home Financials for this Owner
Home Financials are based on the most recent Mortgage that was taken out on this home.
Original Mortgage
$145,400
Outstanding Balance
$102,567
Interest Rate
3.38%
Mortgage Type
New Conventional
Estimated Equity
$436,624
Purchase Details
Closed on
May 24, 2002
Sold by
Providence Homes Inc
Bought by
Babbitt Lorenzo S and Babbitt Karie D
Home Financials for this Owner
Home Financials are based on the most recent Mortgage that was taken out on this home.
Original Mortgage
$82,387
Interest Rate
6.89%
Mortgage Type
New Conventional
Create a Home Valuation Report for This Property
The Home Valuation Report is an in-depth analysis detailing your home's value as well as a comparison with similar homes in the area
Home Values in the Area
Average Home Value in this Area
Purchase History
| Date | Buyer | Sale Price | Title Company |
|---|---|---|---|
| Babbitt Lorenzo S | -- | Accommodation | |
| Babbitt Lorenzo S | $158,387 | Security Title Agency | |
| Providence Homes Inc | $138,588 | Security Title Agency |
Source: Public Records
Mortgage History
| Date | Status | Borrower | Loan Amount |
|---|---|---|---|
| Open | Babbitt Lorenzo S | $145,400 | |
| Closed | Babbitt Lorenzo S | $82,387 |
Source: Public Records
Tax History Compared to Growth
Tax History
| Year | Tax Paid | Tax Assessment Tax Assessment Total Assessment is a certain percentage of the fair market value that is determined by local assessors to be the total taxable value of land and additions on the property. | Land | Improvement |
|---|---|---|---|---|
| 2025 | $1,947 | $26,283 | -- | -- |
| 2024 | $1,889 | $25,031 | -- | -- |
| 2023 | $1,889 | $42,060 | $8,410 | $33,650 |
| 2022 | $1,843 | $34,280 | $6,850 | $27,430 |
| 2021 | $1,996 | $31,810 | $6,360 | $25,450 |
| 2020 | $1,961 | $29,370 | $5,870 | $23,500 |
| 2019 | $1,818 | $27,080 | $5,410 | $21,670 |
| 2018 | $1,730 | $25,370 | $5,070 | $20,300 |
| 2017 | $1,676 | $21,480 | $4,290 | $17,190 |
| 2016 | $1,730 | $21,260 | $4,250 | $17,010 |
| 2015 | $1,594 | $20,320 | $4,060 | $16,260 |
Source: Public Records
Map
Nearby Homes
- 11526 E Shepperd Ave
- 11541 E Corbin Ave
- 4419 S Adelle
- 11551 E Shepperd Ave
- 11512 E Sebring Ave
- 11528 E Sebring Ave
- 11352 E Starkey Ave Unit 1
- 4538 S Tambor
- 11436 E Sonrisa Ave
- 11441 E Sonrisa Ave
- 11306 E Rembrandt Ave
- 11322 E Rembrandt Ave
- 4305 S Antonio
- 11225 E Sylvan Ave
- 11225 E Sonrisa Ave
- 11263 E Savannah Ave
- 11346 E Renata Ave
- 4746 S Emery
- 11027 E Sebring Ave
- 4816 S Emery Unit 1
- 11454 E Rutledge Ave
- 11504 E Rutledge Ave
- 11461 E Roscoe Ave
- 11453 E Roscoe Ave
- 11503 E Roscoe Ave
- 11463 E Rutledge Ave
- 11516 E Rutledge Ave
- 11455 E Rutledge Ave
- 11446 E Rutledge Ave
- 11445 E Roscoe Ave
- 11505 E Rutledge Ave
- 11515 E Roscoe Ave
- 11447 E Rutledge Ave
- 11437 E Roscoe Ave
- 11517 E Rutledge Ave
- 11528 E Rutledge Ave
- 11438 E Rutledge Ave
- 11439 E Rutledge Ave
- 11462 E Roscoe Ave
- 11527 E Roscoe Ave