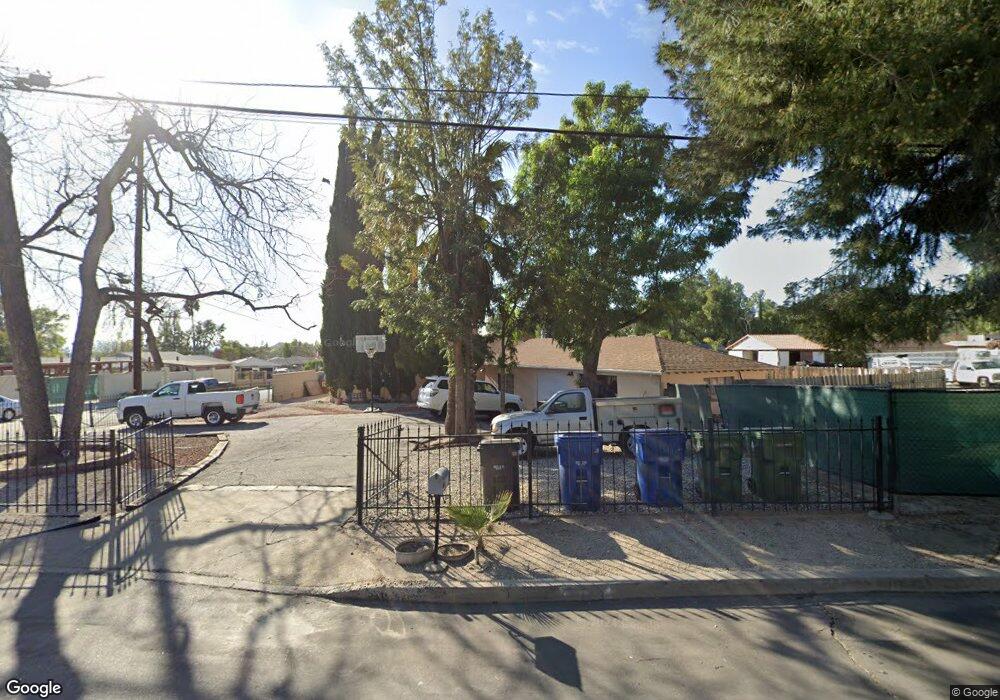
11463 Orcas Ave Sylmar, CA 91342
Estimated Value: $1,153,578 - $1,224,000
2
Beds
2
Baths
1,760
Sq Ft
$674/Sq Ft
Est. Value
About This Home
This home is located at 11463 Orcas Ave, Sylmar, CA 91342 and is currently estimated at $1,186,395, approximately $674 per square foot. 11463 Orcas Ave is a home located in Los Angeles County with nearby schools including Brainard Elementary School, Charles Maclay Middle School, and Mt. Gleason Middle School.
Ownership History
Date
Name
Owned For
Owner Type
Purchase Details
Closed on
Dec 19, 2023
Sold by
Estrada Salvador and Estrada Elda M
Bought by
Sisk Scott and Sisk Raquel Moniqlte
Current Estimated Value
Purchase Details
Closed on
Jan 4, 2021
Sold by
Rettela Dennis M
Bought by
Estrada Salvador and Estrada Elda M
Purchase Details
Closed on
Jan 31, 2014
Sold by
Rettela Dennis
Bought by
Rettela Dennis Michael and Dennis Michael Rettela Revocable Trust
Purchase Details
Closed on
Oct 20, 2006
Sold by
Rettela Dennis and Rettela Christine M
Bought by
Rettela Dennis
Home Financials for this Owner
Home Financials are based on the most recent Mortgage that was taken out on this home.
Original Mortgage
$100,000
Interest Rate
6.39%
Mortgage Type
Credit Line Revolving
Purchase Details
Closed on
Mar 10, 2001
Sold by
Rettela Christine M
Bought by
Rettela Dennis
Create a Home Valuation Report for This Property
The Home Valuation Report is an in-depth analysis detailing your home's value as well as a comparison with similar homes in the area
Home Values in the Area
Average Home Value in this Area
Purchase History
| Date | Buyer | Sale Price | Title Company |
|---|---|---|---|
| Sisk Scott | -- | None Listed On Document | |
| Estrada Salvador | -- | None Listed On Document | |
| Rettela Dennis Michael | -- | None Available | |
| Rettela Dennis | -- | Southland Title | |
| Rettela Dennis | -- | -- |
Source: Public Records
Mortgage History
| Date | Status | Borrower | Loan Amount |
|---|---|---|---|
| Previous Owner | Rettela Dennis | $100,000 |
Source: Public Records
Tax History Compared to Growth
Tax History
| Year | Tax Paid | Tax Assessment Tax Assessment Total Assessment is a certain percentage of the fair market value that is determined by local assessors to be the total taxable value of land and additions on the property. | Land | Improvement |
|---|---|---|---|---|
| 2025 | $13,747 | $1,387,200 | $971,040 | $416,160 |
| 2024 | $13,747 | $1,103,655 | $772,559 | $331,096 |
| 2023 | $1,575 | $96,081 | $27,305 | $68,776 |
| 2022 | $1,517 | $94,198 | $26,770 | $67,428 |
| 2021 | $1,491 | $92,352 | $26,246 | $66,106 |
| 2019 | $1,454 | $89,615 | $25,468 | $64,147 |
| 2018 | $1,249 | $87,859 | $24,969 | $62,890 |
| 2016 | $1,175 | $84,449 | $24,000 | $60,449 |
| 2015 | $1,160 | $83,181 | $23,640 | $59,541 |
| 2014 | $1,185 | $81,552 | $23,177 | $58,375 |
Source: Public Records
Map
Nearby Homes
- 10824 Foothill Blvd
- 10584 Kurt St
- 10635 Foothill Blvd
- 11235 Sunburst St
- 11300 Foothill Blvd Unit 30
- 11569 Bonham Ave
- 11377 Osborne Place Unit 34
- 11350 Foothill Blvd Unit 15
- 11350 Foothill Blvd Unit 30
- 12008 East Trail
- 11609 Garrick Ave
- 11437 Lemoncrest Ave
- 12047 Kagel Canyon Rd
- 12055 Kagel Canyon Rd
- 11374 Hela Ave
- 11715 Garrick Ave
- 0 Spring Trail Unit PW21185754
- 11555 Eldridge Ave
- 12300 Spring Trail
- 11645 N Delft Ln
- 11471 Orcas Ave
- 10927 Longford St
- 11445 Orcas Ave
- 11479 Orcas Ave
- 11470 Orcas Ave
- 10916 Longford St
- 10851 Longford St
- 11511 Orcas Ave
- 10935 Longford St
- 11476 Orcas Ave Unit GH
- 10852 Longford St
- 11476 Orcas Ave Unit GH
- 11476 Orcas Ave
- 11505 Orcas Ave
- 11429 Orcas Ave
- 10940 Longford St
- 11438 Orcas Ave
- 11500 Orcas Ave
- 10949 Longford St
- 11513 Orcas Ave