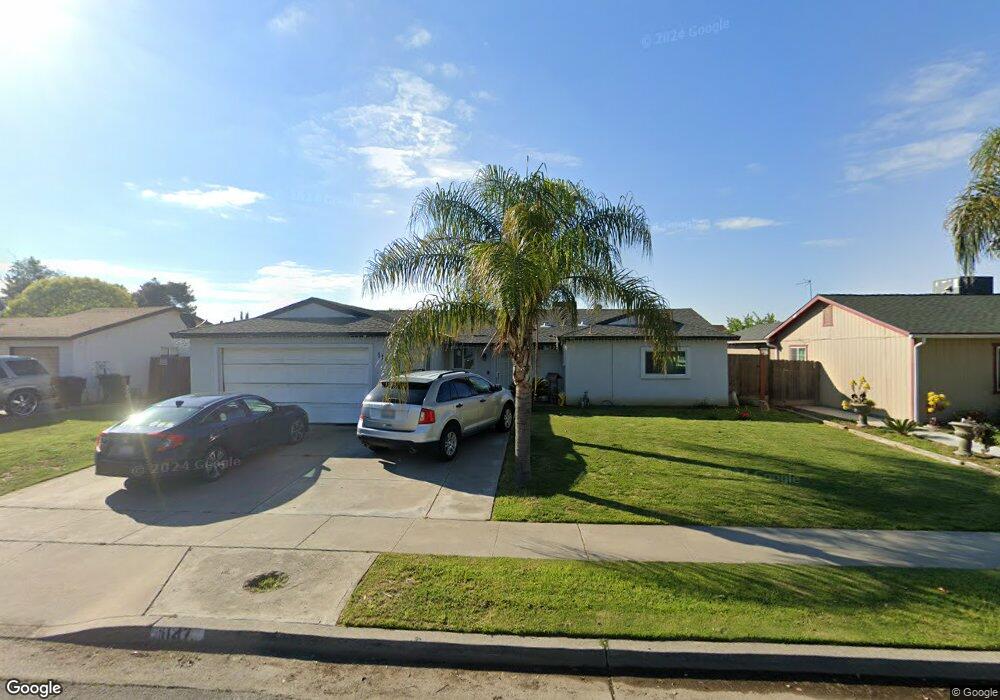
1147 Wren Dr Hanford, CA 93230
Estimated Value: $250,000 - $316,000
3
Beds
2
Baths
1,226
Sq Ft
$239/Sq Ft
Est. Value
About This Home
This home is located at 1147 Wren Dr, Hanford, CA 93230 and is currently estimated at $293,051, approximately $239 per square foot. 1147 Wren Dr is a home located in Kings County with nearby schools including Roosevelt Elementary School, Woodrow Wilson Junior High School, and Hanford West High School.
Ownership History
Date
Name
Owned For
Owner Type
Purchase Details
Closed on
Feb 17, 2023
Sold by
Valdez Agustin
Bought by
Valdez Guadalupe
Current Estimated Value
Home Financials for this Owner
Home Financials are based on the most recent Mortgage that was taken out on this home.
Original Mortgage
$121,200
Outstanding Balance
$113,874
Interest Rate
3%
Mortgage Type
New Conventional
Estimated Equity
$179,177
Purchase Details
Closed on
May 24, 2004
Sold by
Valdez Guadalupe and Olivares Teresa
Bought by
Valdez Agustin and Valdez Guadalupe
Purchase Details
Closed on
Apr 21, 2000
Sold by
Marini Eddy A
Bought by
Olivares Guadalupe and Olivares Teresa
Home Financials for this Owner
Home Financials are based on the most recent Mortgage that was taken out on this home.
Original Mortgage
$81,374
Interest Rate
8.18%
Mortgage Type
FHA
Purchase Details
Closed on
Apr 30, 1999
Sold by
Marini Peter M
Bought by
Marini Eddy A
Create a Home Valuation Report for This Property
The Home Valuation Report is an in-depth analysis detailing your home's value as well as a comparison with similar homes in the area
Home Values in the Area
Average Home Value in this Area
Purchase History
| Date | Buyer | Sale Price | Title Company |
|---|---|---|---|
| Valdez Guadalupe | -- | First American Title | |
| Valdez Agustin | -- | -- | |
| Olivares Guadalupe | $81,500 | Chicago Title Co | |
| Marini Eddy A | -- | -- |
Source: Public Records
Mortgage History
| Date | Status | Borrower | Loan Amount |
|---|---|---|---|
| Open | Valdez Guadalupe | $121,200 | |
| Previous Owner | Olivares Guadalupe | $81,374 |
Source: Public Records
Tax History Compared to Growth
Tax History
| Year | Tax Paid | Tax Assessment Tax Assessment Total Assessment is a certain percentage of the fair market value that is determined by local assessors to be the total taxable value of land and additions on the property. | Land | Improvement |
|---|---|---|---|---|
| 2025 | $1,615 | $152,202 | $36,695 | $115,507 |
| 2023 | $1,615 | $146,294 | $35,271 | $111,023 |
| 2022 | $1,504 | $143,427 | $34,580 | $108,847 |
| 2021 | $1,471 | $140,615 | $33,902 | $106,713 |
| 2020 | $1,485 | $139,173 | $33,554 | $105,619 |
| 2019 | $1,459 | $136,444 | $32,896 | $103,548 |
| 2018 | $1,416 | $133,769 | $32,251 | $101,518 |
| 2017 | $1,393 | $131,146 | $31,619 | $99,527 |
| 2016 | $1,373 | $128,574 | $30,999 | $97,575 |
| 2015 | $1,363 | $126,642 | $30,533 | $96,109 |
| 2014 | $1,335 | $124,161 | $29,935 | $94,226 |
Source: Public Records
Map
Nearby Homes
- 1292 S Monterey Ave
- 1292 Monterey Ave
- 1575 Bluejay Cir
- 1405 Arthur St
- 1426 W Sidonia St
- 1526 W Bison Ln Unit Ae 86
- 1765 Parkside Dr
- 1638 Acres Way
- 1240 Washington St
- 1754 W Twilight St
- Orchid Plan at Live Oak
- Marigold Plan at Live Oak
- Abernathy Plan at Live Oak
- 1452 S Polar Ave
- Beaumont Plan at Live Oak
- Clover Plan at Live Oak
- 735 Manor Ave
- 1842 W Twilight St
- Lot 128 1502 S Autumn Breeze Rd
- 1577 S Barberry Place Unit Ho53