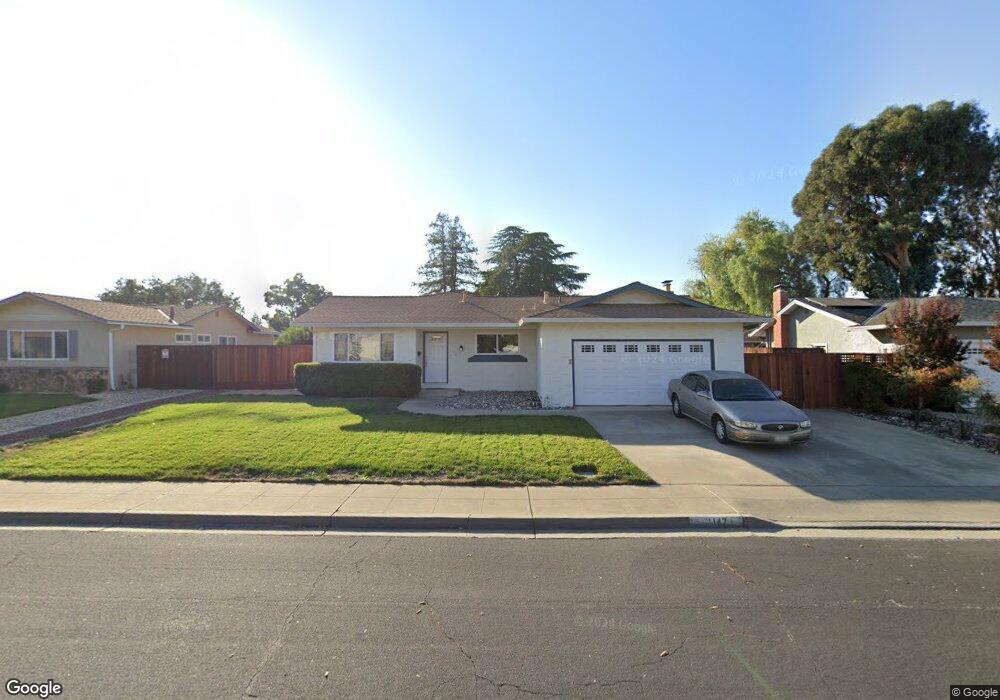
1147 Xavier Way Livermore, CA 94550
Jensen NeighborhoodEstimated Value: $1,056,263 - $1,139,000
3
Beds
2
Baths
1,474
Sq Ft
$747/Sq Ft
Est. Value
About This Home
This home is located at 1147 Xavier Way, Livermore, CA 94550 and is currently estimated at $1,100,816, approximately $746 per square foot. 1147 Xavier Way is a home located in Alameda County with nearby schools including Jackson Avenue Elementary School, East Avenue Middle School, and Livermore High School.
Ownership History
Date
Name
Owned For
Owner Type
Purchase Details
Closed on
Oct 13, 2010
Sold by
Robbins Glen T
Bought by
Keating Gerald A and Carveth Mary E
Current Estimated Value
Home Financials for this Owner
Home Financials are based on the most recent Mortgage that was taken out on this home.
Original Mortgage
$417,691
Outstanding Balance
$275,912
Interest Rate
4.37%
Mortgage Type
FHA
Estimated Equity
$824,904
Purchase Details
Closed on
Aug 28, 2002
Sold by
Robbins Glen Thomas
Bought by
Robbins Glen T
Purchase Details
Closed on
Dec 27, 1994
Sold by
Mclaughlin Robert D and Mclaughlin Pamela E
Bought by
Robbins Glen Thomas
Home Financials for this Owner
Home Financials are based on the most recent Mortgage that was taken out on this home.
Original Mortgage
$198,900
Interest Rate
9.2%
Mortgage Type
Assumption
Create a Home Valuation Report for This Property
The Home Valuation Report is an in-depth analysis detailing your home's value as well as a comparison with similar homes in the area
Home Values in the Area
Average Home Value in this Area
Purchase History
| Date | Buyer | Sale Price | Title Company |
|---|---|---|---|
| Keating Gerald A | $430,000 | Chicago Title Company | |
| Robbins Glen T | -- | -- | |
| Robbins Glen Thomas | $199,000 | Old Republic Title Company |
Source: Public Records
Mortgage History
| Date | Status | Borrower | Loan Amount |
|---|---|---|---|
| Open | Keating Gerald A | $417,691 | |
| Previous Owner | Robbins Glen Thomas | $198,900 |
Source: Public Records
Tax History Compared to Growth
Tax History
| Year | Tax Paid | Tax Assessment Tax Assessment Total Assessment is a certain percentage of the fair market value that is determined by local assessors to be the total taxable value of land and additions on the property. | Land | Improvement |
|---|---|---|---|---|
| 2025 | $7,059 | $543,872 | $165,261 | $385,611 |
| 2024 | $7,059 | $533,074 | $162,022 | $378,052 |
| 2023 | $6,946 | $529,488 | $158,846 | $370,642 |
| 2022 | $6,838 | $512,108 | $155,732 | $363,376 |
| 2021 | $6,087 | $501,930 | $152,679 | $356,251 |
| 2020 | $6,626 | $503,714 | $151,114 | $352,600 |
| 2019 | $6,649 | $493,841 | $148,152 | $345,689 |
| 2018 | $6,502 | $484,161 | $145,248 | $338,913 |
| 2017 | $6,331 | $474,671 | $142,401 | $332,270 |
| 2016 | $6,092 | $465,367 | $139,610 | $325,757 |
| 2015 | $5,718 | $458,380 | $137,514 | $320,866 |
| 2014 | $5,617 | $449,401 | $134,820 | $314,581 |
Source: Public Records
Map
Nearby Homes
- 736 Adams Ave
- 3732 Carrigan Common
- 3857 Pestana Way
- 1368 Pegan Common
- 3959 Purdue Way
- 3877 Santa Clara Way
- 1324 Chateau Common Unit 206
- 3283 East Ave
- 4382 Colgate Way
- 476 Beverly St
- 3973 Duke Way
- 772 Mcleod St
- 368 Beverly St
- 3491 Madeira Way
- 202 Sonia Way
- 236 Plum Tree St
- 1153 Sherry Way
- 1377 Lillian St
- 3713 First St
- 2878 4th St Unit 1401
- 1125 Xavier Way
- 1155 Xavier Way
- 1165 Xavier Way
- 1113 Xavier Way
- 4114 Xavier Ct
- 1166 Hillcrest Ave
- 1144 Xavier Way
- 1158 Hillcrest Ave
- 1174 Hillcrest Ave
- 1144 Hillcrest Ave
- 1188 Hillcrest Ave
- 1179 Xavier Way
- 1095 Xavier Way
- 4122 Xavier Ct
- 1140 Tulane Ct
- 1128 Hillcrest Ave
- 4188 Xavier Ct
- 1098 Xavier Way
- 1192 Hillcrest Ave
- 4130 Xavier Ct