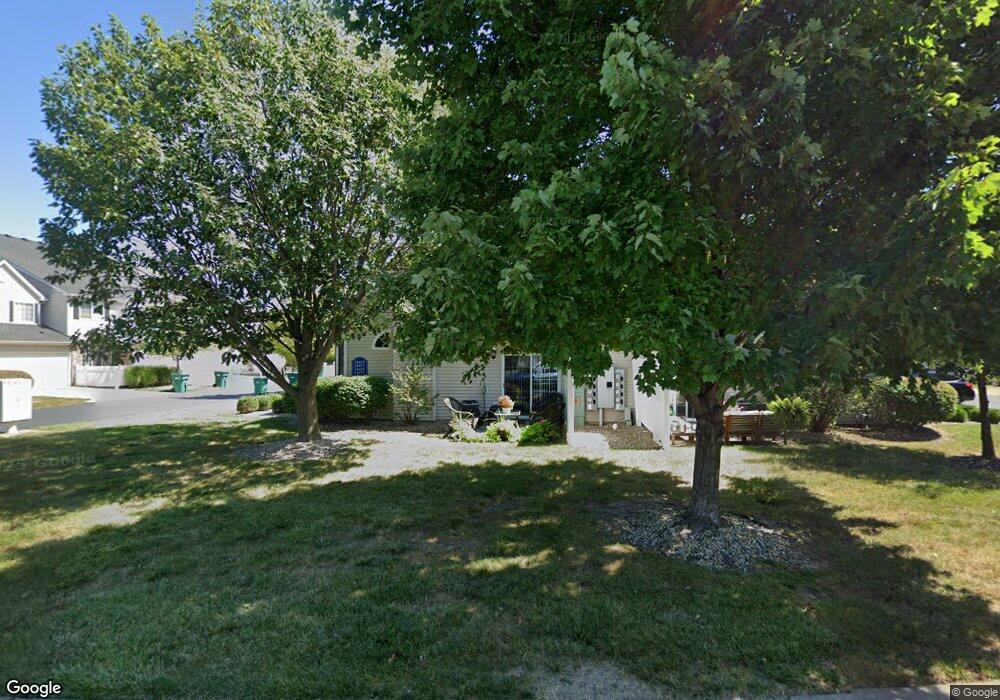
11475 Enclave Blvd Fishers, IN 46038
Estimated Value: $258,000 - $284,000
2
Beds
2
Baths
1,632
Sq Ft
$165/Sq Ft
Est. Value
About This Home
This home is located at 11475 Enclave Blvd, Fishers, IN 46038 and is currently estimated at $269,083, approximately $164 per square foot. 11475 Enclave Blvd is a home located in Hamilton County with nearby schools including Fishers Elementary School, Riverside Junior High School, and Riverside Intermediate School.
Ownership History
Date
Name
Owned For
Owner Type
Purchase Details
Closed on
Aug 20, 2014
Sold by
Wagoner Charles E and Wagoner Shannon J
Bought by
Stiglitz Lisa M
Current Estimated Value
Home Financials for this Owner
Home Financials are based on the most recent Mortgage that was taken out on this home.
Original Mortgage
$92,000
Outstanding Balance
$69,199
Interest Rate
4.14%
Mortgage Type
New Conventional
Estimated Equity
$199,884
Purchase Details
Closed on
Jun 9, 2008
Sold by
Jannsen Brett R
Bought by
Wagoner Charles E and Powell Shannon J
Home Financials for this Owner
Home Financials are based on the most recent Mortgage that was taken out on this home.
Original Mortgage
$123,880
Interest Rate
6.04%
Mortgage Type
FHA
Purchase Details
Closed on
Dec 26, 2000
Sold by
The Augusta Group Llc
Bought by
Crenshaw Latasha
Home Financials for this Owner
Home Financials are based on the most recent Mortgage that was taken out on this home.
Original Mortgage
$107,525
Interest Rate
7.77%
Mortgage Type
FHA
Create a Home Valuation Report for This Property
The Home Valuation Report is an in-depth analysis detailing your home's value as well as a comparison with similar homes in the area
Home Values in the Area
Average Home Value in this Area
Purchase History
| Date | Buyer | Sale Price | Title Company |
|---|---|---|---|
| Stiglitz Lisa M | -- | None Available | |
| Wagoner Charles E | -- | None Available | |
| Crenshaw Latasha | -- | -- |
Source: Public Records
Mortgage History
| Date | Status | Borrower | Loan Amount |
|---|---|---|---|
| Open | Stiglitz Lisa M | $92,000 | |
| Previous Owner | Wagoner Charles E | $123,880 | |
| Previous Owner | Crenshaw Latasha | $107,525 |
Source: Public Records
Tax History
| Year | Tax Paid | Tax Assessment Tax Assessment Total Assessment is a certain percentage of the fair market value that is determined by local assessors to be the total taxable value of land and additions on the property. | Land | Improvement |
|---|---|---|---|---|
| 2025 | $2,453 | $250,100 | $57,000 | $193,100 |
| 2024 | $2,063 | $223,500 | $57,000 | $166,500 |
| 2023 | $2,108 | $204,200 | $43,000 | $161,200 |
| 2022 | $1,984 | $186,500 | $43,000 | $143,500 |
| 2021 | $1,692 | $163,300 | $34,000 | $129,300 |
| 2020 | $1,414 | $143,700 | $34,000 | $109,700 |
| 2019 | $1,335 | $138,000 | $25,300 | $112,700 |
| 2018 | $1,229 | $128,100 | $25,300 | $102,800 |
| 2017 | $1,085 | $119,200 | $25,300 | $93,900 |
| 2016 | $1,013 | $114,800 | $25,300 | $89,500 |
| 2014 | $822 | $108,400 | $25,300 | $83,100 |
| 2013 | $822 | $113,800 | $25,300 | $88,500 |
Source: Public Records
Map
Nearby Homes
- 11373 Nickel Row
- 11372 Nickel Row
- 8261 Dan Allen Dr
- 8677 Morgan Dr
- 8686 Morgan Dr
- 8694 Morgan Dr
- 8704 Morgan Dr
- 8188 Bostic Ct
- 11288 Ashley Place
- 11179 Avery Row
- 11709 Cameron Dr
- 11124 Ashley Place
- 11303 Hartford Ln
- 11902 Bryden Place
- 11495 Crestview Dr
- 7648 Madden Ln
- 11903 Corbin Dr
- 12036 Citywalk Dr
- 7591 Timber Springs Dr
- 7731 Kenetta Ct
- 11477 Enclave Blvd
- 11479 Enclave Blvd
- 11467 Enclave Blvd
- 11465 Enclave Blvd
- 11469 Enclave Blvd
- 11473 Enclave Blvd
- 11471 Enclave Blvd
- 11483 Enclave Blvd Unit 39
- 11483 Enclave Blvd
- 11481 Enclave Blvd
- 11485 Enclave Blvd
- 11487 Enclave Blvd
- 11487 Enclave Blvd Unit 37
- 11487 Enclave Blvd Unit 5/37
- 11457 Enclave Blvd
- 11457 Enclave Blvd Unit 7/52
- 11491 Enclave Blvd
- 11461 Enclave Blvd
- 11461 Enclave Blvd
- 11461 Enclave Blvd Unit 50
Your Personal Tour Guide
Ask me questions while you tour the home.