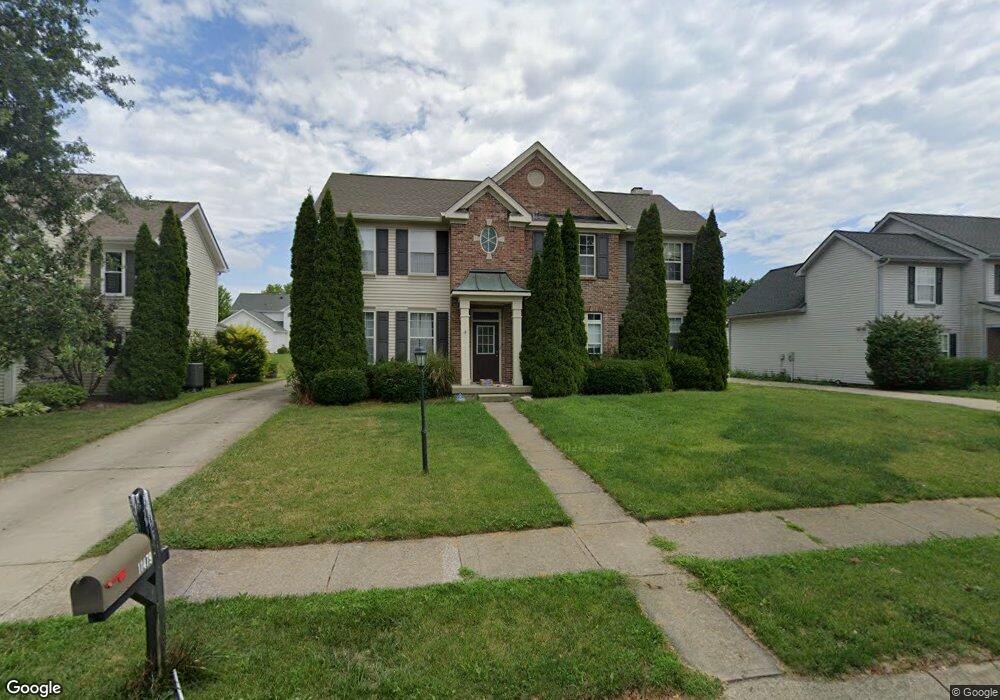
11479 Feather Rock Ct Fishers, IN 46037
Estimated Value: $430,000 - $468,000
4
Beds
3
Baths
3,284
Sq Ft
$138/Sq Ft
Est. Value
About This Home
This home is located at 11479 Feather Rock Ct, Fishers, IN 46037 and is currently estimated at $452,546, approximately $137 per square foot. 11479 Feather Rock Ct is a home located in Hamilton County with nearby schools including Hickok Elementary School, Fall Creek Elementary School, and Fall Creek Intermediate School.
Ownership History
Date
Name
Owned For
Owner Type
Purchase Details
Closed on
Dec 13, 2017
Sold by
Wiese Richard S and Wiese Stephanie K
Bought by
Wiese Stephanie K
Current Estimated Value
Home Financials for this Owner
Home Financials are based on the most recent Mortgage that was taken out on this home.
Original Mortgage
$195,300
Outstanding Balance
$161,401
Interest Rate
3.25%
Mortgage Type
Adjustable Rate Mortgage/ARM
Estimated Equity
$291,145
Purchase Details
Closed on
Aug 25, 2008
Sold by
Ritter Robert C and Ritter Paula K
Bought by
Wiese Richard S and Wiese Stephanie K
Home Financials for this Owner
Home Financials are based on the most recent Mortgage that was taken out on this home.
Original Mortgage
$223,924
Interest Rate
5.96%
Mortgage Type
FHA
Purchase Details
Closed on
Apr 29, 2003
Sold by
Ritter Robert C and Richardson Paula K
Bought by
Ritter Robert C and Ritter Puala K
Create a Home Valuation Report for This Property
The Home Valuation Report is an in-depth analysis detailing your home's value as well as a comparison with similar homes in the area
Home Values in the Area
Average Home Value in this Area
Purchase History
| Date | Buyer | Sale Price | Title Company |
|---|---|---|---|
| Wiese Stephanie K | -- | None Available | |
| Wiese Richard S | -- | Lawyers Title | |
| Ritter Robert C | -- | -- |
Source: Public Records
Mortgage History
| Date | Status | Borrower | Loan Amount |
|---|---|---|---|
| Open | Wiese Stephanie K | $195,300 | |
| Previous Owner | Wiese Richard S | $223,924 |
Source: Public Records
Tax History Compared to Growth
Tax History
| Year | Tax Paid | Tax Assessment Tax Assessment Total Assessment is a certain percentage of the fair market value that is determined by local assessors to be the total taxable value of land and additions on the property. | Land | Improvement |
|---|---|---|---|---|
| 2024 | $4,543 | $402,000 | $47,300 | $354,700 |
| 2023 | $4,543 | $397,400 | $47,300 | $350,100 |
| 2022 | $3,509 | $339,700 | $47,300 | $292,400 |
| 2021 | $3,509 | $294,400 | $47,300 | $247,100 |
| 2020 | $3,366 | $281,800 | $47,300 | $234,500 |
| 2019 | $3,101 | $260,400 | $40,300 | $220,100 |
| 2018 | $2,995 | $251,200 | $40,300 | $210,900 |
| 2017 | $2,766 | $236,400 | $40,300 | $196,100 |
| 2016 | $2,538 | $222,000 | $40,300 | $181,700 |
| 2014 | $2,382 | $221,300 | $40,300 | $181,000 |
| 2013 | $2,382 | $215,600 | $40,300 | $175,300 |
Source: Public Records
Map
Nearby Homes
- 11517 Moss Rock Ct
- 11502 Hearthstone Dr
- 12864 Hanley Dr
- 12430 Hyacinth Dr
- 11416 Forest Knoll Cir
- 11932 Hollyhock Dr
- 10990 Brooks School Rd
- 290 Breakwater Dr
- 10982 Brooks School Rd
- 11101 Hawthorn Ridge
- 11318 Talon Trace
- 10725 Crum Ct
- 13091 Duval Dr
- 10704 Club Chase
- 11833 Walker Ln
- 12337 River Valley Dr
- 12307 Chiseled Stone Dr
- 12089 Red Hawk Dr
- 12419 Brandamore Ln
- 10746 Haven Cove Way
- 11499 Feather Rock Ct
- 11459 Feather Rock Ct
- 11468 Little Rock Ct
- 11519 Feather Rock C
- 11519 Feather Rock Ct
- 11488 Little Rock Ct
- 11448 Little Rock Ct
- 11439 Feather Rock Ct
- 11439 Feather Rock C
- 11478 Feather Rock Ct
- 11428 Little Rock Ct
- 11508 Little Rock Ct
- 11498 Feather Rock Ct
- 11458 Feather Rock Ct
- 11539 Feather Rock C
- 11539 Feather Rock Ct
- 11518 Feather Rock Ct
- 11419 Feather Rock Ct
- 11528 Little Rock Ct
- 11438 Feather Rock Ct