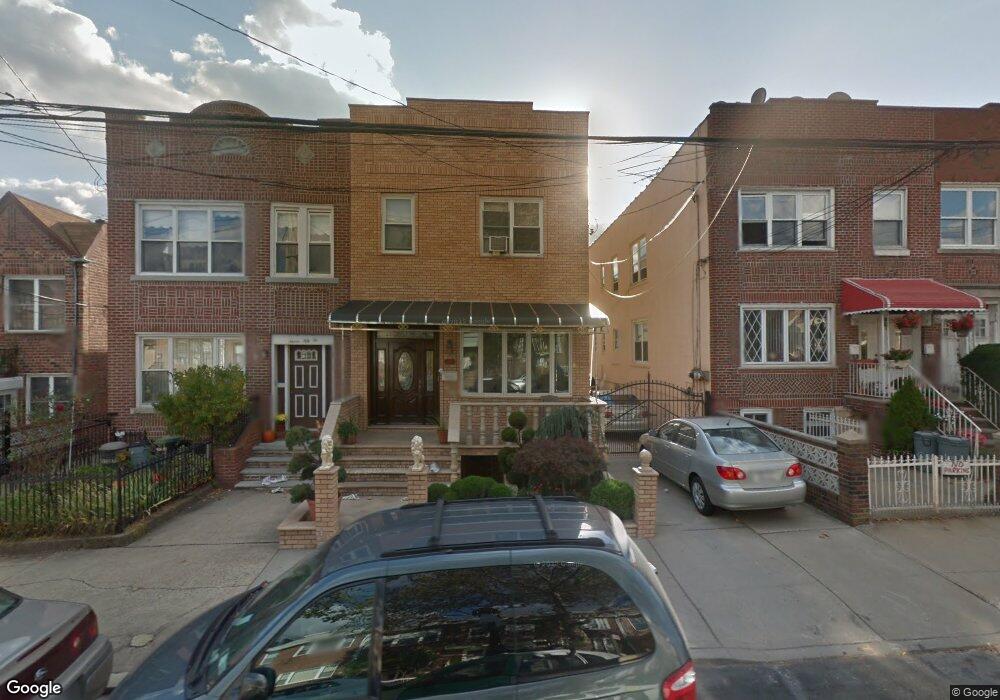
1148 73rd St Brooklyn, NY 11228
Dyker Heights NeighborhoodEstimated Value: $1,430,000 - $1,699,000
Studio
--
Bath
2,200
Sq Ft
$698/Sq Ft
Est. Value
About This Home
This home is located at 1148 73rd St, Brooklyn, NY 11228 and is currently estimated at $1,536,204, approximately $698 per square foot. 1148 73rd St is a home located in Kings County with nearby schools including P.S. 127 McKinley Park, IS 201 Madeleine Brennan Intermediate School, and New Utrecht High School.
Ownership History
Date
Name
Owned For
Owner Type
Purchase Details
Closed on
Nov 15, 2000
Sold by
Lovisi Vivian A
Bought by
Chan Sammy Yisun and Siew Peck
Current Estimated Value
Home Financials for this Owner
Home Financials are based on the most recent Mortgage that was taken out on this home.
Original Mortgage
$283,000
Interest Rate
7.52%
Create a Home Valuation Report for This Property
The Home Valuation Report is an in-depth analysis detailing your home's value as well as a comparison with similar homes in the area
Home Values in the Area
Average Home Value in this Area
Purchase History
| Date | Buyer | Sale Price | Title Company |
|---|---|---|---|
| Chan Sammy Yisun | $463,000 | -- |
Source: Public Records
Mortgage History
| Date | Status | Borrower | Loan Amount |
|---|---|---|---|
| Previous Owner | Chan Sammy Yisun | $283,000 |
Source: Public Records
Tax History
| Year | Tax Paid | Tax Assessment Tax Assessment Total Assessment is a certain percentage of the fair market value that is determined by local assessors to be the total taxable value of land and additions on the property. | Land | Improvement |
|---|---|---|---|---|
| 2025 | $10,850 | $88,800 | $26,760 | $62,040 |
| 2024 | $10,850 | $88,080 | $26,760 | $61,320 |
| 2023 | $10,833 | $77,340 | $26,760 | $50,580 |
| 2022 | $10,071 | $75,060 | $26,760 | $48,300 |
| 2021 | $10,005 | $68,760 | $26,760 | $42,000 |
| 2019 | $9,368 | $78,900 | $26,760 | $52,140 |
| 2018 | $9,002 | $45,619 | $18,598 | $27,021 |
| 2017 | $8,514 | $43,238 | $16,246 | $26,992 |
| 2016 | $7,845 | $40,791 | $18,303 | $22,488 |
| 2015 | $4,700 | $38,485 | $19,165 | $19,320 |
| 2014 | $4,700 | $38,485 | $20,095 | $18,390 |
Source: Public Records
Map
Nearby Homes
- 1133 73rd St
- 1114 Bay Ridge Pkwy
- 1077 Bay Ridge Pkwy
- 1106 Bay Ridge Pkwy
- 1147 71st St
- 1225 Bay Ridge Pkwy
- 1154 76th St
- 1049 Bay Ridge Pkwy
- 1149 70th St
- 1155 77th St
- 7302 13th Ave
- 1142 Bay Ridge Ave
- 1075 77th St
- 7202 13th Ave
- 1042 70th St
- 7205 10th Ave
- 1127 78th St
- 1220 77th St
- 7413 13th Ave
- 1219 78th St
Your Personal Tour Guide
Ask me questions while you tour the home.