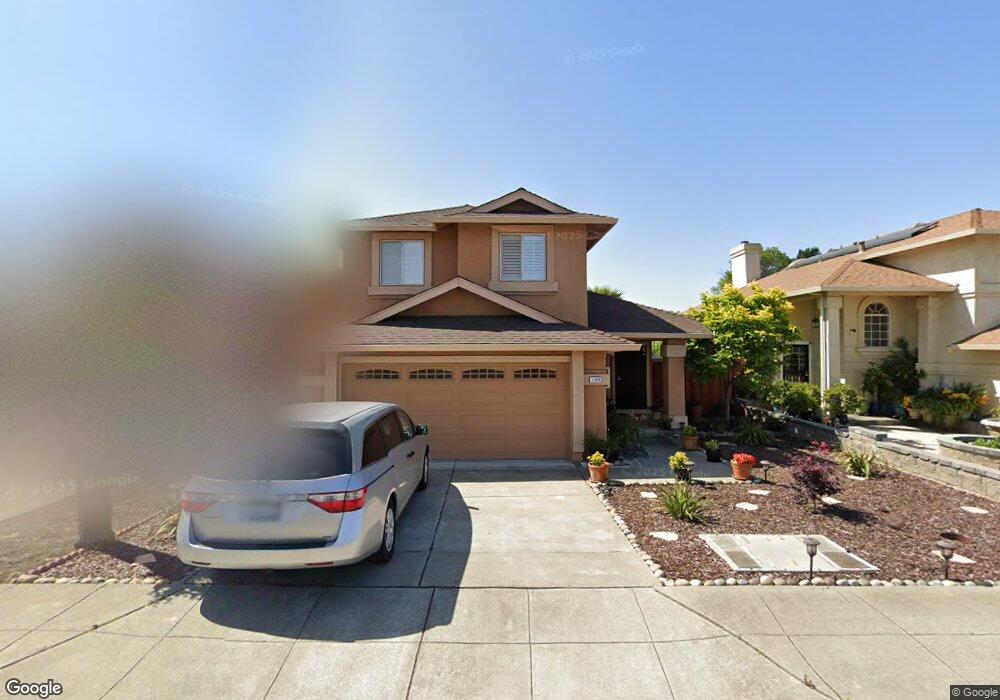
1148 Boulder Creek Dr Hayward, CA 94544
Tennyson-Alquire NeighborhoodEstimated Value: $800,000 - $1,162,000
4
Beds
4
Baths
1,805
Sq Ft
$543/Sq Ft
Est. Value
About This Home
This home is located at 1148 Boulder Creek Dr, Hayward, CA 94544 and is currently estimated at $979,820, approximately $542 per square foot. 1148 Boulder Creek Dr is a home located in Alameda County with nearby schools including Ruus Elementary School, Cesar Chavez Middle School, and Tennyson High School.
Ownership History
Date
Name
Owned For
Owner Type
Purchase Details
Closed on
Aug 13, 2011
Sold by
Nacu Francisco G and Nacu Maria Corazon A
Bought by
Nacu Francisco G and Nacu Ma Corazon A
Current Estimated Value
Home Financials for this Owner
Home Financials are based on the most recent Mortgage that was taken out on this home.
Original Mortgage
$150,900
Interest Rate
4.53%
Mortgage Type
New Conventional
Purchase Details
Closed on
Dec 11, 2005
Sold by
Nacu Francisco G and Nacu Ma Corazon A
Bought by
Nacu Francisco G and Nacu Ma Corazon A
Purchase Details
Closed on
Jul 3, 2000
Sold by
Jan Ford Al and Jan Vanderzanden
Bought by
Nacu Francisco G and Nacu Maria Corazon A
Home Financials for this Owner
Home Financials are based on the most recent Mortgage that was taken out on this home.
Original Mortgage
$311,400
Outstanding Balance
$114,583
Interest Rate
8.63%
Estimated Equity
$865,237
Create a Home Valuation Report for This Property
The Home Valuation Report is an in-depth analysis detailing your home's value as well as a comparison with similar homes in the area
Home Values in the Area
Average Home Value in this Area
Purchase History
| Date | Buyer | Sale Price | Title Company |
|---|---|---|---|
| Nacu Francisco G | -- | Cornerstone Title Company | |
| Nacu Francisco G | -- | None Available | |
| Frank & Cora Nacu Trust | -- | -- | |
| Nacu Francisco G | $346,000 | American Title Co |
Source: Public Records
Mortgage History
| Date | Status | Borrower | Loan Amount |
|---|---|---|---|
| Closed | Nacu Francisco G | $150,900 | |
| Open | Nacu Francisco G | $311,400 |
Source: Public Records
Tax History Compared to Growth
Tax History
| Year | Tax Paid | Tax Assessment Tax Assessment Total Assessment is a certain percentage of the fair market value that is determined by local assessors to be the total taxable value of land and additions on the property. | Land | Improvement |
|---|---|---|---|---|
| 2025 | $7,023 | $572,557 | $156,398 | $423,159 |
| 2024 | $7,023 | $561,194 | $153,332 | $414,862 |
| 2023 | $6,918 | $557,055 | $150,326 | $406,729 |
| 2022 | $6,783 | $539,135 | $147,379 | $398,756 |
| 2021 | $6,726 | $528,426 | $144,489 | $390,937 |
| 2020 | $6,652 | $529,938 | $143,008 | $386,930 |
| 2019 | $6,704 | $519,548 | $140,204 | $379,344 |
| 2018 | $5,686 | $458,186 | $137,456 | $320,730 |
| 2017 | $5,555 | $449,204 | $134,761 | $314,443 |
| 2016 | $5,236 | $440,398 | $132,119 | $308,279 |
| 2015 | $5,131 | $433,786 | $130,136 | $303,650 |
| 2014 | $4,872 | $425,291 | $127,587 | $297,704 |
Source: Public Records
Map
Nearby Homes
- 1127 Hat Creek Way
- 1352 Chelsea Way
- 1438 Salamanca Ave
- 1439 Almeria Dr
- 27906 Thackeray Ave
- 29043 Windemere Rd
- 1541 Ortega Ave Unit 39
- 878 Folsom Ave
- 1580 Balein Ct Unit 14
- 1400 Buckingham Way
- 1587 de Lemos Ave
- 27949 Thornton Ct Unit 1B
- 918 W Tennyson Rd Unit 105
- 27923 Havana Ave
- 27781 Dickens Ave
- 28845 La Corona St
- 28882 Miranda St
- 552 Celia St
- 27828 Mandarin Ave
- 29270 Sandburg Way Unit 234
- 1142 Boulder Creek Dr
- 1154 Boulder Creek Dr
- 1160 Boulder Creek Dr
- 1136 Boulder Creek Dr
- 1187 Folsom Ave
- 1125 Boulder Creek Dr
- 1168 Boulder Creek Dr
- 1128 Boulder Creek Dr
- 1159 Boulder Creek Dr
- 1223 Folsom Ave
- 1175 Folsom Ave
- 1117 Boulder Creek Dr
- 28673 Harvey Ave
- 1174 Boulder Creek Dr
- 1158 Hat Creek Way
- 1122 Hat Creek Way
- 28669 Harvey Ave
- 1199 Folsom Ave
- 1182 Boulder Creek Dr
- 1183 Boulder Creek Dr