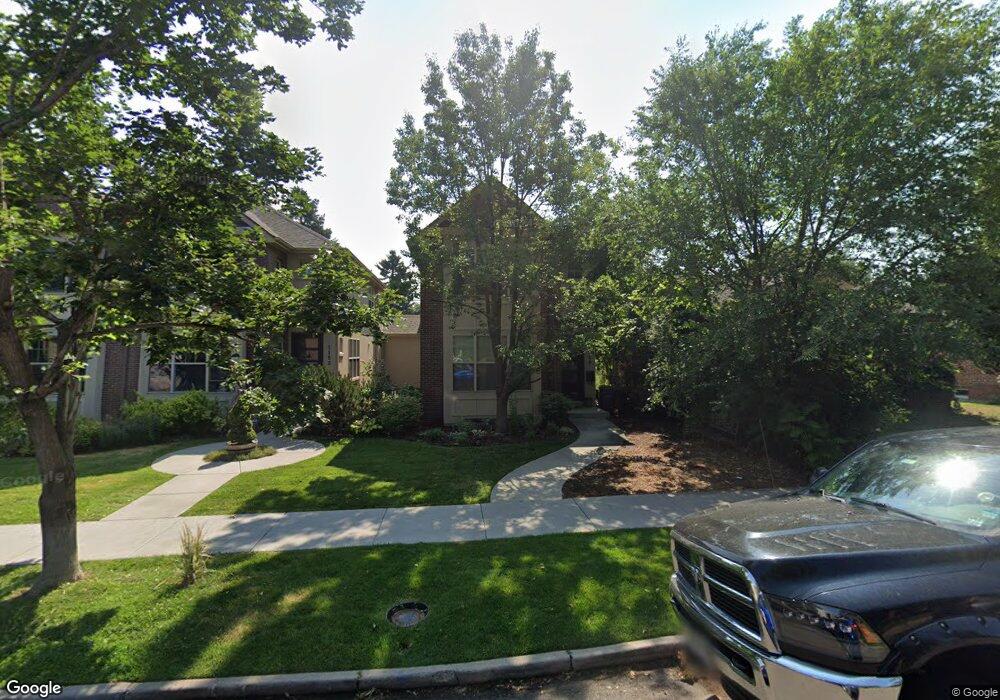
1148 Monroe St Denver, CO 80206
Congress Park NeighborhoodEstimated Value: $1,076,898 - $1,206,000
2
Beds
3
Baths
2,977
Sq Ft
$388/Sq Ft
Est. Value
About This Home
This home is located at 1148 Monroe St, Denver, CO 80206 and is currently estimated at $1,154,633, approximately $387 per square foot. 1148 Monroe St is a home located in Denver County with nearby schools including Teller Elementary School, Morey Middle School, and East High School.
Ownership History
Date
Name
Owned For
Owner Type
Purchase Details
Closed on
May 15, 2012
Sold by
Monroe Partners Llc
Bought by
Goodman Susan L
Current Estimated Value
Home Financials for this Owner
Home Financials are based on the most recent Mortgage that was taken out on this home.
Original Mortgage
$377,600
Outstanding Balance
$261,988
Interest Rate
3.93%
Mortgage Type
New Conventional
Estimated Equity
$892,645
Purchase Details
Closed on
Mar 31, 2008
Sold by
Building Traditions Ltd
Bought by
Monroe Partners Llc
Home Financials for this Owner
Home Financials are based on the most recent Mortgage that was taken out on this home.
Original Mortgage
$1,328,600
Interest Rate
6.11%
Mortgage Type
Purchase Money Mortgage
Purchase Details
Closed on
Jul 30, 2007
Sold by
Fulmor William P and Fulmor Francine B
Bought by
Building Traditions Ltd
Home Financials for this Owner
Home Financials are based on the most recent Mortgage that was taken out on this home.
Original Mortgage
$412,250
Interest Rate
6.64%
Mortgage Type
Purchase Money Mortgage
Create a Home Valuation Report for This Property
The Home Valuation Report is an in-depth analysis detailing your home's value as well as a comparison with similar homes in the area
Home Values in the Area
Average Home Value in this Area
Purchase History
| Date | Buyer | Sale Price | Title Company |
|---|---|---|---|
| Goodman Susan L | $472,000 | None Available | |
| Monroe Partners Llc | -- | None Available | |
| Building Traditions Ltd | $485,000 | Land Title |
Source: Public Records
Mortgage History
| Date | Status | Borrower | Loan Amount |
|---|---|---|---|
| Open | Goodman Susan L | $377,600 | |
| Previous Owner | Monroe Partners Llc | $1,328,600 | |
| Previous Owner | Building Traditions Ltd | $412,250 |
Source: Public Records
Tax History
| Year | Tax Paid | Tax Assessment Tax Assessment Total Assessment is a certain percentage of the fair market value that is determined by local assessors to be the total taxable value of land and additions on the property. | Land | Improvement |
|---|---|---|---|---|
| 2025 | $5,714 | $82,500 | $25,510 | $25,510 |
| 2024 | $5,714 | $72,150 | $20,560 | $51,590 |
| 2023 | $5,591 | $72,150 | $20,560 | $51,590 |
| 2022 | $5,086 | $63,960 | $20,120 | $43,840 |
| 2021 | $4,910 | $65,800 | $20,700 | $45,100 |
| 2020 | $4,575 | $61,660 | $19,410 | $42,250 |
| 2019 | $4,447 | $61,660 | $19,410 | $42,250 |
| 2018 | $3,990 | $51,580 | $11,730 | $39,850 |
| 2017 | $3,979 | $51,580 | $11,730 | $39,850 |
| 2016 | $3,507 | $43,000 | $11,526 | $31,474 |
Source: Public Records
Map
Nearby Homes
- 1231 Garfield St
- 1058 Garfield St
- 1051 Jackson St
- 1070 Cook St Unit 1072
- 1247 Harrison St
- 1324 Garfield St
- 1367 Monroe St
- 1366 Garfield St Unit 505
- 1035 Colorado Blvd Unit 406
- 1013 Adams St
- 1121 Albion St Unit 910
- 1121 Albion St Unit 207
- 1121 Albion St Unit 407
- 1121 Albion St Unit 205
- 1121 Albion St Unit 906
- 1121 Albion St Unit 704
- 1417 Monroe St
- 1370 Adams St
- 4110 Hale Pkwy Unit 6C
- 4110 Hale Pkwy Unit 5F
- 1148 Monroe St
- 1152 Monroe St
- 1144 Monroe St
- 1156 Monroe St
- 1136 Monroe St
- 1162 Monroe St
- 1166 Monroe St Unit B
- 1134 Monroe St
- 1134 Monroe St Unit 1136
- 1160 Monroe St
- 1160 Monroe St Unit (2 Units)
- 1128 Monroe St
- 1170 Monroe St Unit A
- 3610 E 12th Ave
- 1126 Monroe St Unit 1128
- 1151 Monroe St
- 1151 Monroe St Unit 3
- 1149 Garfield St
- 1157 N Garfield St
- 1135 Monroe St
Your Personal Tour Guide
Ask me questions while you tour the home.