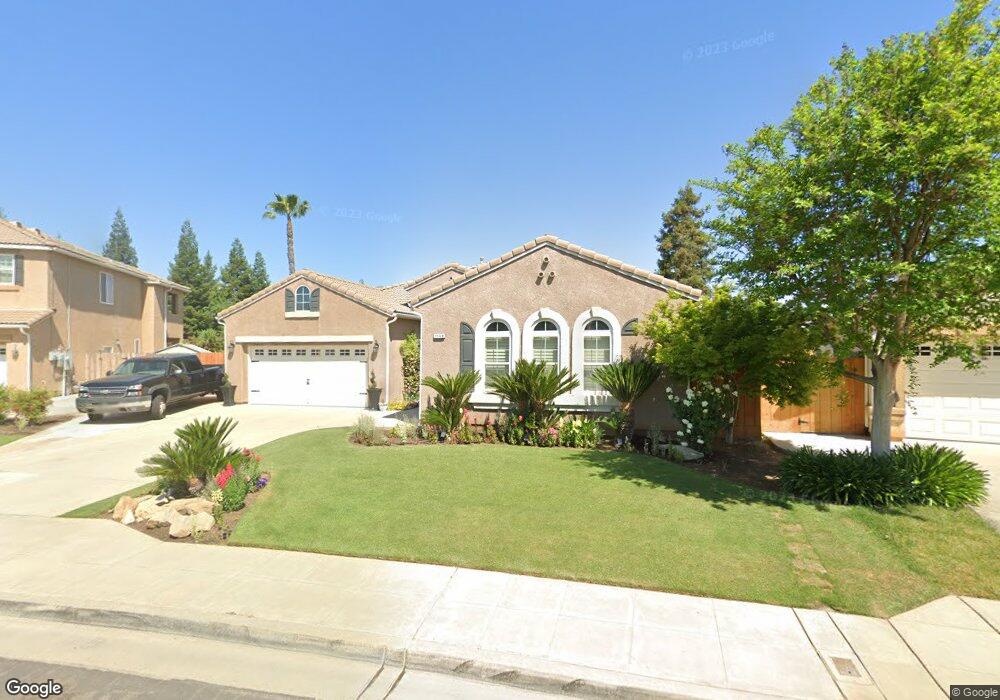
1148 N Applegate Ave Clovis, CA 93611
Estimated Value: $613,000 - $666,000
4
Beds
3
Baths
2,061
Sq Ft
$310/Sq Ft
Est. Value
About This Home
This home is located at 1148 N Applegate Ave, Clovis, CA 93611 and is currently estimated at $638,832, approximately $309 per square foot. 1148 N Applegate Ave is a home located in Fresno County with nearby schools including Dry Creek Elementary School, Alta Sierra Intermediate School, and Buchanan High School.
Ownership History
Date
Name
Owned For
Owner Type
Purchase Details
Closed on
Jul 11, 2018
Sold by
Lowitz Darryl C and Lowitz Jamie L
Bought by
Lowitz Darryl and Lowitz Jamie
Current Estimated Value
Purchase Details
Closed on
Mar 9, 2007
Sold by
Hill Dale and Hill Tracey
Bought by
Lowitz Darryl C and Lowitz Jamie L
Home Financials for this Owner
Home Financials are based on the most recent Mortgage that was taken out on this home.
Original Mortgage
$339,000
Outstanding Balance
$205,529
Interest Rate
6.29%
Mortgage Type
New Conventional
Estimated Equity
$433,303
Purchase Details
Closed on
Dec 22, 2003
Sold by
Granville Homes Inc
Bought by
Hill Dale and Hill Tracey
Home Financials for this Owner
Home Financials are based on the most recent Mortgage that was taken out on this home.
Original Mortgage
$258,196
Interest Rate
4.87%
Mortgage Type
Purchase Money Mortgage
Create a Home Valuation Report for This Property
The Home Valuation Report is an in-depth analysis detailing your home's value as well as a comparison with similar homes in the area
Home Values in the Area
Average Home Value in this Area
Purchase History
| Date | Buyer | Sale Price | Title Company |
|---|---|---|---|
| Lowitz Darryl | -- | None Available | |
| Lowitz Darryl C | $479,000 | Financial Title Company | |
| Hill Dale | $323,000 | Financial Title Company |
Source: Public Records
Mortgage History
| Date | Status | Borrower | Loan Amount |
|---|---|---|---|
| Open | Lowitz Darryl C | $339,000 | |
| Previous Owner | Hill Dale | $258,196 |
Source: Public Records
Tax History
| Year | Tax Paid | Tax Assessment Tax Assessment Total Assessment is a certain percentage of the fair market value that is determined by local assessors to be the total taxable value of land and additions on the property. | Land | Improvement |
|---|---|---|---|---|
| 2025 | $6,842 | $571,100 | $139,200 | $431,900 |
| 2023 | $6,505 | $543,300 | $132,500 | $410,800 |
| 2022 | $6,359 | $527,600 | $128,700 | $398,900 |
| 2021 | $5,386 | $451,000 | $110,000 | $341,000 |
| 2020 | $4,935 | $410,000 | $100,000 | $310,000 |
| 2019 | $4,758 | $395,000 | $105,000 | $290,000 |
| 2018 | $4,465 | $371,000 | $106,000 | $265,000 |
| 2017 | $4,227 | $350,000 | $100,000 | $250,000 |
| 2016 | $4,051 | $340,000 | $105,000 | $235,000 |
| 2015 | $4,068 | $342,700 | $96,900 | $245,800 |
| 2014 | $3,819 | $321,000 | $90,800 | $230,200 |
Source: Public Records
Map
Nearby Homes
- 2670 Muncie Ave
- 2770 Muncie Ave
- 2643 Quincy Ave
- 2361 Cromwell Ave
- 971 N Filbert Ave
- 1 Ave
- 1345 N Kaweah Ave
- 3091 Teague Ave
- 3205 Lexington Ave
- 2936 Trenton Ave
- 2117 Goshen Ave
- 1617 N Megan Ave
- 2966 Trenton Ave
- 1734 N Park Ave
- 2944 Vermont Ave
- 1731 N Hanson Ave
- 2997 Trenton Ave
- 3088 Teague Ave
- 1565 N Kaweah Ave
- 1719 N Whitmore Ave
- 1140 N Applegate Ave
- 1156 N Applegate Ave
- 1132 N Applegate Ave
- 1143 N Applegate Ave
- 2657 Goshen Ave
- 1124 N Applegate Ave
- 2625 Goshen Ave
- 1153 N Applegate Ave
- 2633 Goshen Ave
- 1134 N Coventry Ave
- 2665 Goshen Ave
- 2670 Nees Ave
- 2719 Jordan Ave
- 2673 Goshen Ave
- 1126 N Coventry Ave
- 2727 Jordan Ave
- 2648 Goshen Ave
- 2640 Goshen Ave
- 2617 Goshen Ave
- 2656 Goshen Ave
Your Personal Tour Guide
Ask me questions while you tour the home.