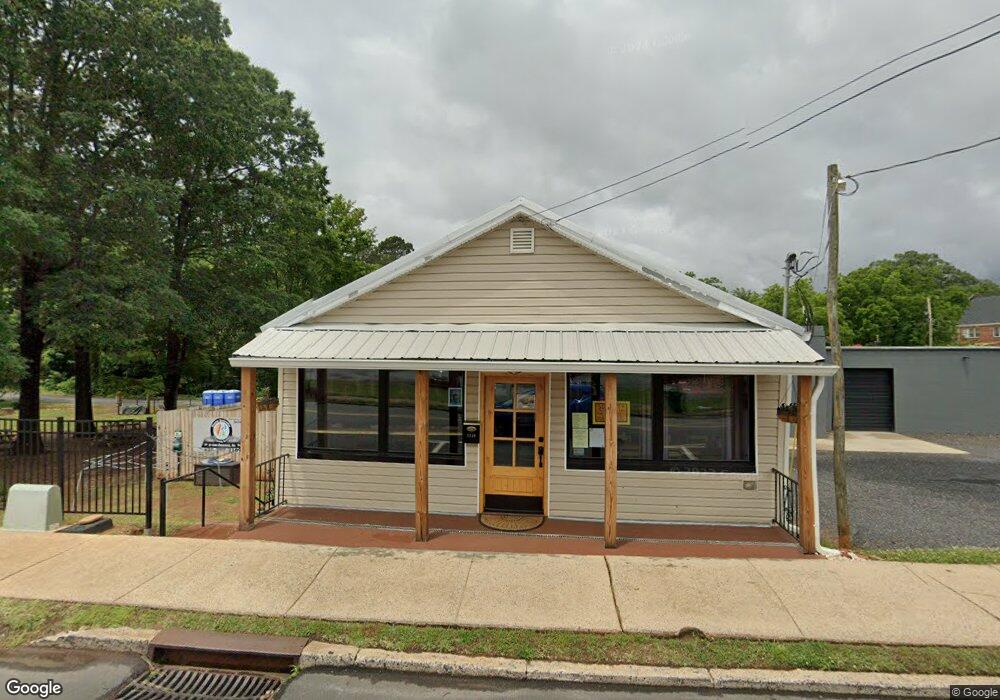
1148 N Main Ave Newton, NC 28658
--
Bed
--
Bath
2,143
Sq Ft
5,227
Sq Ft Lot
About This Home
This home is located at 1148 N Main Ave, Newton, NC 28658. 1148 N Main Ave is a home located in Catawba County with nearby schools including North Newton Elementary School, Newton-Conover Middle School, and Newton-Conover High School.
Ownership History
Date
Name
Owned For
Owner Type
Purchase Details
Closed on
Mar 4, 2024
Sold by
Iriarte Morgan Dee
Bought by
Hass John Wesley and Nell Abernet Wepner Hannah
Purchase Details
Closed on
Nov 27, 2018
Sold by
Whitson Donna L and Whitson Charles Wayne
Bought by
Little Morgan Dee
Home Financials for this Owner
Home Financials are based on the most recent Mortgage that was taken out on this home.
Original Mortgage
$31,000
Interest Rate
4.8%
Mortgage Type
Commercial
Purchase Details
Closed on
Nov 9, 2011
Sold by
Jones Martha Sharron
Bought by
Little Morgan
Purchase Details
Closed on
Dec 28, 2006
Sold by
Lafone Donald H and Lafone Frances B
Bought by
Jones Martha Sharron
Home Financials for this Owner
Home Financials are based on the most recent Mortgage that was taken out on this home.
Original Mortgage
$25,000
Interest Rate
6.19%
Mortgage Type
Seller Take Back
Purchase Details
Closed on
Feb 1, 1979
Create a Home Valuation Report for This Property
The Home Valuation Report is an in-depth analysis detailing your home's value as well as a comparison with similar homes in the area
Home Values in the Area
Average Home Value in this Area
Purchase History
| Date | Buyer | Sale Price | Title Company |
|---|---|---|---|
| Hass John Wesley | $285,000 | None Listed On Document | |
| Little Morgan Dee | $30,000 | None Available | |
| Little Morgan | $16,500 | None Available | |
| Jones Martha Sharron | $30,000 | None Available | |
| -- | $12,000 | -- |
Source: Public Records
Mortgage History
| Date | Status | Borrower | Loan Amount |
|---|---|---|---|
| Previous Owner | Little Morgan Dee | $31,000 | |
| Previous Owner | Jones Martha Sharron | $25,000 |
Source: Public Records
Tax History Compared to Growth
Tax History
| Year | Tax Paid | Tax Assessment Tax Assessment Total Assessment is a certain percentage of the fair market value that is determined by local assessors to be the total taxable value of land and additions on the property. | Land | Improvement |
|---|---|---|---|---|
| 2025 | $877 | $103,400 | $7,800 | $95,600 |
| 2024 | $877 | $103,400 | $7,800 | $95,600 |
| 2023 | $877 | $103,400 | $7,800 | $95,600 |
| 2022 | $855 | $76,700 | $10,500 | $66,200 |
| 2021 | $626 | $56,100 | $10,500 | $45,600 |
| 2020 | $385 | $34,500 | $10,500 | $24,000 |
| 2019 | $385 | $34,500 | $0 | $0 |
| 2018 | $241 | $21,600 | $10,500 | $11,100 |
| 2017 | $241 | $0 | $0 | $0 |
| 2016 | $241 | $0 | $0 | $0 |
| 2015 | $209 | $21,600 | $10,500 | $11,100 |
| 2014 | $209 | $20,700 | $7,800 | $12,900 |
Source: Public Records
Map
Nearby Homes
- 00 E 13th St Unit 3
- 00 E 13th St Unit 2
- 1208 N Davis Ave
- 902 N Ashe Ave
- 204 W 10th St
- 210 W 15th St
- 418 W 9th St
- 608 E 11th St
- 425 W 8th St
- 509 W 8th St
- 621 W 13th St
- 1128 McRee Heights Cir
- 310 W 4th St
- 504 N Spring Ave
- 216 N Davis Ave
- 300 N Ervin Ave
- The Braselton II Plan at Rowe Crossing
- The Harrington Plan at Rowe Crossing
- The Coleman Plan at Rowe Crossing
- The Piedmont Plan at Rowe Crossing
- 1201 N Shipp Ave
- 1208 N Main Ave
- 1134 N Main Ave
- 1190 N Shipp Ave
- 1130 N Main Ave
- 1200 N Shipp Ave
- 1128 N Main Ave
- 1206 N Shipp Ave
- 1214 N Main Ave
- 1124 N Main Ave
- 1122 N Main Ave
- 1120 N Main Ave
- 1116 N Main Ave
- 1143 N Ashe Ave
- 1115 N Main Ave
- 1141 N Ashe Ave
- 1141 N Ashe Ave Unit 2
- 1111 N Main Ave
- 1108 N Main Ave
- 1295 N Main Ave