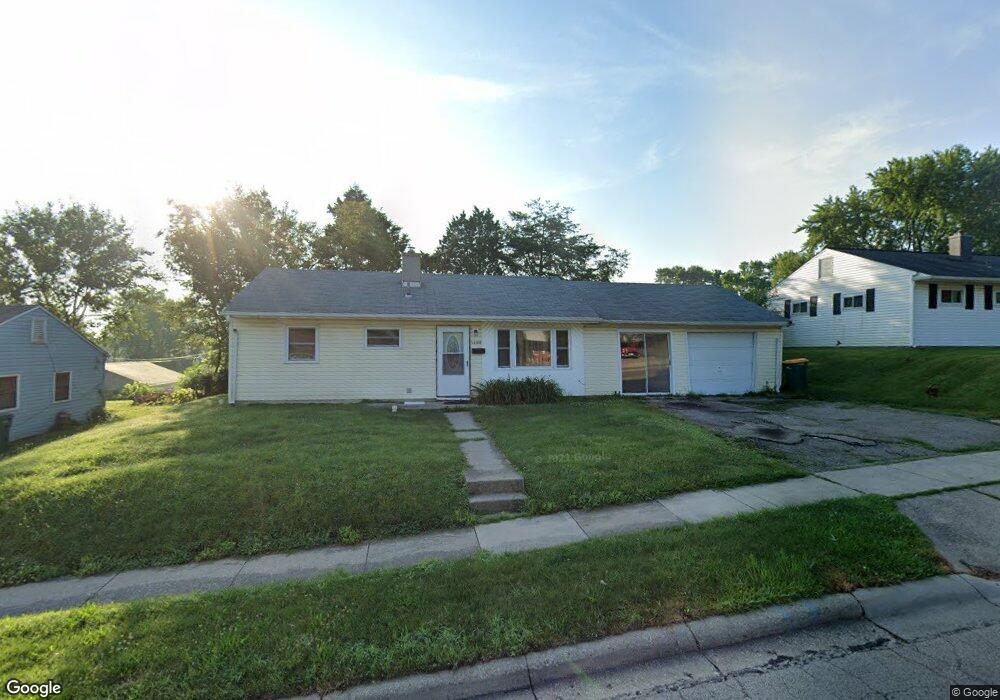
1148 S Maple Ave Fairborn, OH 45324
Estimated Value: $122,000 - $180,000
4
Beds
1
Bath
1,056
Sq Ft
$134/Sq Ft
Est. Value
About This Home
This home is located at 1148 S Maple Ave, Fairborn, OH 45324 and is currently estimated at $141,155, approximately $133 per square foot. 1148 S Maple Ave is a home located in Greene County with nearby schools including Fairborn Primary School, Fairborn Intermediate School, and Fairborn Middle School.
Ownership History
Date
Name
Owned For
Owner Type
Purchase Details
Closed on
Aug 22, 2024
Sold by
Vb One Llc
Bought by
Vb Nine Llc
Current Estimated Value
Purchase Details
Closed on
Aug 4, 2021
Sold by
Victory Property Llc
Bought by
Vb One Llc
Purchase Details
Closed on
May 24, 2021
Sold by
New Residential Mortgage Loan Tr 2017 6
Bought by
Victory Property Llc
Purchase Details
Closed on
Mar 31, 2021
Sold by
Shetty Charles D and Shetty Charles
Bought by
Citibank Na and New Residential Mortgage Loan Trust 210
Purchase Details
Closed on
Oct 17, 1994
Sold by
Pence Arnold
Bought by
Setty Charles D and Setty L
Home Financials for this Owner
Home Financials are based on the most recent Mortgage that was taken out on this home.
Original Mortgage
$61,000
Interest Rate
8.55%
Mortgage Type
New Conventional
Create a Home Valuation Report for This Property
The Home Valuation Report is an in-depth analysis detailing your home's value as well as a comparison with similar homes in the area
Home Values in the Area
Average Home Value in this Area
Purchase History
| Date | Buyer | Sale Price | Title Company |
|---|---|---|---|
| Vb Nine Llc | $977,000 | None Listed On Document | |
| Vb One Llc | $82,000 | None Available | |
| Victory Property Llc | $66,150 | None Available | |
| Citibank Na | $67,840 | None Available | |
| Setty Charles D | $60,000 | -- |
Source: Public Records
Mortgage History
| Date | Status | Borrower | Loan Amount |
|---|---|---|---|
| Previous Owner | Setty Charles D | $61,000 |
Source: Public Records
Tax History
| Year | Tax Paid | Tax Assessment Tax Assessment Total Assessment is a certain percentage of the fair market value that is determined by local assessors to be the total taxable value of land and additions on the property. | Land | Improvement |
|---|---|---|---|---|
| 2024 | $1,756 | $36,410 | $9,200 | $27,210 |
| 2023 | $1,744 | $36,410 | $9,200 | $27,210 |
| 2022 | $1,702 | $21,180 | $6,570 | $14,610 |
| 2021 | $1,334 | $23,110 | $6,570 | $16,540 |
| 2020 | $1,341 | $23,110 | $6,570 | $16,540 |
| 2019 | $1,298 | $22,390 | $5,820 | $16,570 |
| 2018 | $1,311 | $22,390 | $5,820 | $16,570 |
| 2017 | $1,283 | $22,390 | $5,820 | $16,570 |
| 2016 | $1,313 | $22,400 | $5,820 | $16,580 |
| 2015 | $1,252 | $22,400 | $5,820 | $16,580 |
| 2014 | $1,211 | $22,400 | $5,820 | $16,580 |
Source: Public Records
Map
Nearby Homes
- 1108 Lexington Ave
- 1267 Beech St
- 135 E Garland Ave
- 38 Lindway Dr
- 1222 Hemlock Dr
- 1878 Wildflower Rd
- 45 Regina Dr
- 0 W Garland Ave
- 818 Flintridge Dr
- 1408 Mapleridge Dr
- 849 Flintridge Dr
- 201 State St
- 239-241 Euclid Ave
- 153 Diana Ln N
- 1463 Maplegrove Dr
- 256 Euclid Ave
- 406 Chapelgate Dr
- 315 Greene St
- 504 Greene St
- 437 Kirkwood Dr
- 1140 S Maple Ave
- 1156 S Maple Ave
- 39 Brockway Ct
- 45 Brockway Ct
- 33 Brockway Ct
- 1132 S Maple Ave
- 27 Brockway Ct
- 1149 S Maple Ave
- 1141 S Maple Ave
- 51 Brockway Ct
- 1155 S Maple Ave
- 21 Brockway Ct
- 1124 S Maple Ave
- 1135 S Maple Ave
- 1163 S Maple Ave
- 1121 S Maple Ave
- 1172 S Maple Ave
- 209 E Doris Dr
- 15 Brockway Ct
- 215 E Doris Dr
Your Personal Tour Guide
Ask me questions while you tour the home.