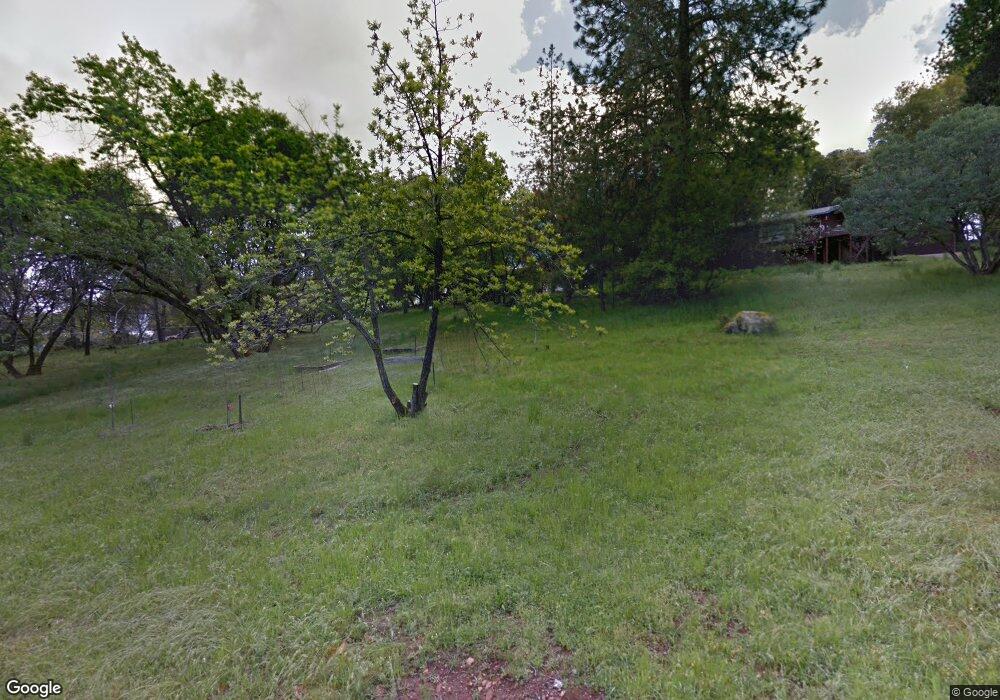
11480 Blackledge Rd Penn Valley, CA 95946
Estimated Value: $292,000 - $560,000
3
Beds
2
Baths
1,517
Sq Ft
$302/Sq Ft
Est. Value
About This Home
This home is located at 11480 Blackledge Rd, Penn Valley, CA 95946 and is currently estimated at $457,841, approximately $301 per square foot. 11480 Blackledge Rd is a home located in Nevada County with nearby schools including Ready Springs Elementary School, Williams Ranch Elementary School, and Vantage Point Charter School.
Ownership History
Date
Name
Owned For
Owner Type
Purchase Details
Closed on
Apr 14, 2016
Sold by
Walker Stanley R and Walker Pauline
Bought by
The Stanley & Pauline Walker Living Trus
Current Estimated Value
Purchase Details
Closed on
May 16, 2000
Sold by
Dublirer and Dorothy
Bought by
Walker Stan and Walker Pauline
Home Financials for this Owner
Home Financials are based on the most recent Mortgage that was taken out on this home.
Original Mortgage
$152,000
Outstanding Balance
$52,663
Interest Rate
8.18%
Mortgage Type
Seller Take Back
Estimated Equity
$405,178
Purchase Details
Closed on
Sep 5, 1997
Sold by
Dublirer Arthur and Dublirer Dorothy
Bought by
Dublirer Arthur and Dublirer Dorothy
Purchase Details
Closed on
Aug 14, 1997
Sold by
Brennan Daniel L and Brennan Susan C
Bought by
Dublirer Arthur and Dublirer Dorothy
Create a Home Valuation Report for This Property
The Home Valuation Report is an in-depth analysis detailing your home's value as well as a comparison with similar homes in the area
Home Values in the Area
Average Home Value in this Area
Purchase History
| Date | Buyer | Sale Price | Title Company |
|---|---|---|---|
| The Stanley & Pauline Walker Living Trus | -- | None Available | |
| Walker Stan | $177,000 | First American Title Ins Co | |
| Dublirer Arthur | -- | -- | |
| Dublirer Arthur | -- | First American Title Ins Co |
Source: Public Records
Mortgage History
| Date | Status | Borrower | Loan Amount |
|---|---|---|---|
| Open | Walker Stan | $152,000 |
Source: Public Records
Tax History Compared to Growth
Tax History
| Year | Tax Paid | Tax Assessment Tax Assessment Total Assessment is a certain percentage of the fair market value that is determined by local assessors to be the total taxable value of land and additions on the property. | Land | Improvement |
|---|---|---|---|---|
| 2025 | $3,304 | $272,019 | $81,447 | $190,572 |
| 2024 | $3,240 | $266,686 | $79,850 | $186,836 |
| 2023 | $3,240 | $261,458 | $78,285 | $183,173 |
| 2022 | $3,172 | $256,332 | $76,750 | $179,582 |
| 2021 | $3,075 | $251,307 | $75,246 | $176,061 |
| 2020 | $3,062 | $248,731 | $74,475 | $174,256 |
| 2019 | $2,999 | $243,855 | $73,015 | $170,840 |
| 2018 | $0 | $239,075 | $71,584 | $167,491 |
| 2017 | $2,885 | $234,388 | $70,181 | $164,207 |
| 2016 | $2,785 | $229,793 | $68,805 | $160,988 |
| 2015 | $2,746 | $226,342 | $67,772 | $158,570 |
| 2014 | $2,701 | $221,909 | $66,445 | $155,464 |
Source: Public Records
Map
Nearby Homes
- 19600 Martinsburg Ln
- 11461 Buckeye Ct
- 10988 Pleasant Valley Rd
- 20652 Chaparral Cir
- 11665 Redwing Ct
- 19100 W Ridge Dr
- 19252 Jayhawk Dr
- 19662 Chaparral Cir
- 20058 Echo Blue Dr
- 11816 Warbler Way
- 20003 Echo Blue Dr
- 11817 Warbler Way
- 20197 Chaparral Cir
- 11839 Warbler Way
- 18905 W Ridge Dr
- 18367 Jayhawk Dr
- 18850 Jayhawk Dr
- 11965 Marble Ct
- 18370 Jayhawk Dr
- 10966 Badger Ct
- 11570 Blackledge Rd
- 19508 Toyon Dr
- 11660 Blackledge Rd
- 11533 Blackledge Rd
- 19426 Los Robles Ln
- 19234 Cobblers Way
- 19400 Toyon Dr
- 19240 Los Robles Ln
- 19212 Cobblers Way
- 11575 Blackledge Rd
- 19144 Cobblers Way
- 19402 Wildwood West Dr
- 19260 Wildwood West Dr
- 19402 Wildwood Dr W
- 11075 Homestead Ln
- 19289 Los Robles Ln
- 11230 Pleasant Valley Rd
- 11720 Pleasant Valley Rd
- 11812 Wildwood Ranch Rd