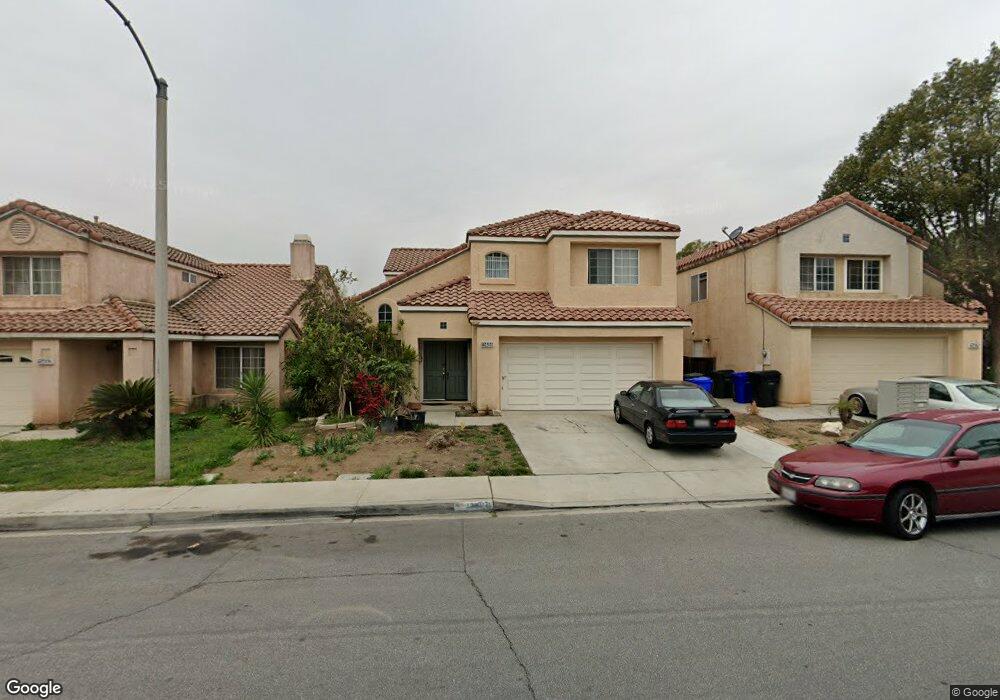
11486 Leatherleaf Rd Fontana, CA 92337
Southridge Village NeighborhoodEstimated Value: $638,000 - $732,000
4
Beds
3
Baths
2,415
Sq Ft
$280/Sq Ft
Est. Value
About This Home
This home is located at 11486 Leatherleaf Rd, Fontana, CA 92337 and is currently estimated at $675,612, approximately $279 per square foot. 11486 Leatherleaf Rd is a home located in San Bernardino County with nearby schools including Jurupa Vista Elementary School, Ruth O. Harris Middle School, and Bloomington High School.
Ownership History
Date
Name
Owned For
Owner Type
Purchase Details
Closed on
Oct 11, 2016
Sold by
Molina Alfredo
Bought by
Molina Alfredo and Molina Eva M
Current Estimated Value
Home Financials for this Owner
Home Financials are based on the most recent Mortgage that was taken out on this home.
Original Mortgage
$227,000
Interest Rate
3.44%
Mortgage Type
New Conventional
Purchase Details
Closed on
Aug 26, 2011
Sold by
Molina Eva
Bought by
Molina Alfredo
Home Financials for this Owner
Home Financials are based on the most recent Mortgage that was taken out on this home.
Original Mortgage
$246,750
Interest Rate
4.46%
Mortgage Type
New Conventional
Purchase Details
Closed on
Jul 15, 2004
Sold by
Molina Eva
Bought by
Molina Alfredo
Home Financials for this Owner
Home Financials are based on the most recent Mortgage that was taken out on this home.
Original Mortgage
$237,000
Interest Rate
5.3%
Mortgage Type
Negative Amortization
Create a Home Valuation Report for This Property
The Home Valuation Report is an in-depth analysis detailing your home's value as well as a comparison with similar homes in the area
Home Values in the Area
Average Home Value in this Area
Purchase History
| Date | Buyer | Sale Price | Title Company |
|---|---|---|---|
| Molina Alfredo | -- | First American Title Company | |
| Molina Alfredo | -- | Pacific Coast Title | |
| Molina Alfredo | -- | Orange Coast Title La Mirada |
Source: Public Records
Mortgage History
| Date | Status | Borrower | Loan Amount |
|---|---|---|---|
| Closed | Molina Alfredo | $227,000 | |
| Closed | Molina Alfredo | $246,750 | |
| Closed | Molina Alfredo | $237,000 |
Source: Public Records
Tax History Compared to Growth
Tax History
| Year | Tax Paid | Tax Assessment Tax Assessment Total Assessment is a certain percentage of the fair market value that is determined by local assessors to be the total taxable value of land and additions on the property. | Land | Improvement |
|---|---|---|---|---|
| 2025 | $4,625 | $300,907 | $62,409 | $238,498 |
| 2024 | $4,625 | $295,007 | $61,185 | $233,822 |
| 2023 | $4,271 | $289,222 | $59,985 | $229,237 |
| 2022 | $4,204 | $283,551 | $58,809 | $224,742 |
| 2021 | $4,258 | $277,991 | $57,656 | $220,335 |
| 2020 | $4,272 | $275,141 | $57,065 | $218,076 |
| 2019 | $4,174 | $269,746 | $55,946 | $213,800 |
| 2018 | $4,117 | $264,457 | $54,849 | $209,608 |
| 2017 | $3,997 | $259,272 | $53,774 | $205,498 |
| 2016 | $4,077 | $254,189 | $52,720 | $201,469 |
| 2015 | $6,382 | $250,371 | $51,928 | $198,443 |
| 2014 | $3,856 | $245,467 | $50,911 | $194,556 |
Source: Public Records
Map
Nearby Homes
- 11415 Aberdeen Dr
- 15849 Firethorn Rd
- 11544 Sheffield Rd
- 11355 Tondela St
- 15965 Peach Tree Ln
- 15793 Willow Dr
- 11484 Lime Orchard Ln
- 11337 Concord Cir
- 15313 Coleen St
- 16200 Coleen St
- 12022 Loyola Ct
- 11460 Lone Tree Ct
- 14963 Colby Place
- Plan 2000 at Parkview - Arbor at Parkview
- Plan 1877 at Parkview - Arbor at Parkview
- Plan 1666 at Parkview - Arbor at Parkview
- 10881 Oleander Ave
- Plan 2320 at Parkview - Canopy at Parkview
- Plan 2056 at Parkview - Canopy at Parkview
- Plan 1791 at Parkview - Canopy at Parkview
- 11492 Leatherleaf Rd
- 11476 Leatherleaf Rd
- 11498 Leatherleaf Rd
- 11470 Leatherleaf Rd
- 11506 Leatherleaf Rd
- 11462 Leatherleaf Rd
- 11479 Leatherleaf Rd
- 11495 Leatherleaf Rd
- 11471 Leatherleaf Rd
- 11512 Leatherleaf Rd
- 11499 Leatherleaf Rd
- 11454 Leatherleaf Rd
- 11463 Leatherleaf Rd
- 15731 Smoketree Ln
- 11457 Leatherleaf Rd
- 15716 Firethorn Rd
- 15740 Smoketree Ln
- 11520 Leatherleaf Rd
- 11448 Leatherleaf Rd
- 11485 Aberdeen Dr